Understanding Graphs Step by Step
To guide student learning, the Common Core State Standards for Mathematics and the Next Generation Science Standards emphasize instructional practices that require more than recalling facts or applying familiar procedures.
Why? Because increasingly teachers, parents, employers—all of us—expect students to become flexible thinkers and problem solvers who flourish in the face of rapid changes in the workplace, university and global society.
The new STEM standards pose challenging goals for students: making sense of unfamiliar problems, using tools strategically to solve problems and design solutions, constructing viable arguments and explanations, critiquing the reasoning of others and asking the right questions. For many schools, achieving these goals— which are more complex than old definitions of “basic skills”—will be difficult.
There are already reports (e.g., in New York and Kentucky) of students scoring significantly lower on state tests aligned with the new standards. It will take years for schools to update curricula, instruction and assessments, and for students to achieve these ambitious new STEM education goals. Our mission at the Concord Consortium is to use technology in deeply digital ways that transform education in support of the new standards.
Our free Web-based SmartGraphs and Graph Literacy activities help students make sense of graphs by providing questions that lead to understanding, step by step, and by showing students visual hints on the graph as well as explanations. Students interact with graphs by drawing on or annotating them using a computer mouse or touchscreen.
SmartGraphs
The new math and science standards assert that students should have a more fluent understanding of graphs. Students are already taught to graph points, lines and functions, but now they are asked to understand unfamiliar graphs in textbooks, newspapers and scientific journals. Whether students look at graphs about climate change, the national debt, planning for retirement or many other phenomena, we now have higher expectations that they can “read” these graphs and make sense of them, in the way they are expected to read unfamiliar texts.
Textbooks, it turns out, do not do a great job of teaching “graph literacy.” Decades of studies have shown that even undergraduate students studying science find it difficult to interpret unfamiliar graphs. Like mathematical formulas, graphs pack a great deal of information into a small space. They may look simple, but looks may be deceiving. Graphs often convey complex information, so students must develop general graph literacy skills.
We’ve created a suite of free activities that cover a wide range of graph-related topics. Plus, teachers or other curriculum writers can create their own activities by completing online forms without any special programming skills.
Graph literacy
Learning to read graphs is a skill that transcends any particular subject, just as learning to read is important beyond any one subject. For example, virtually all students, even those in upper elementary school, should be able to draw a graph representing simple motion, such as walking forward and backward at different speeds on a straight path. Understanding this type of position-time graph requires understanding the graph title, the axis labels, grid lines on the graph, what it means to connect points and so on—fundamental graph literacy skills that can be applied to any graph.
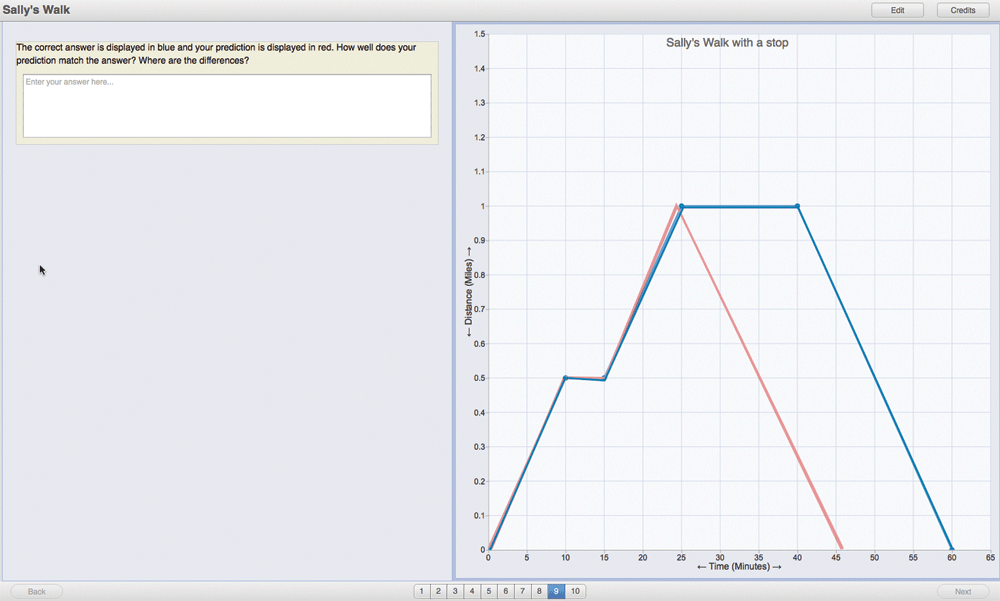
In one example, a student reads a short story about someone walking to the bank, to the store and back home again, and then, using a mouse or touchscreen, draws a graph representing that story. The student’s graph, in red, is then compared to the correct graph, in blue (Figure 1). Repeated trials, including visual feedback from SmartGraphs, provide students new ways to understand how a graph can represent a word story, and vice versa.
Graphs in algebra
High school algebra is filled with graphs, but the course is a serious trouble spot in many schools. Requiring algebra for all students is becoming common in the U.S. For instance, while more than 60% of California students take algebra in grade 8, thousands fail or repeat the class because they are not prepared. At the national level, too, test scores for 17-year-olds on the National Assessment of Educational Progress (NAEP) math test have been flat from 1973 to 2012, despite growing pressure on schools during those forty years to improve achievement in math and science. We believe our graphing software can help teachers and students do a better job in algebra and other high school math courses.
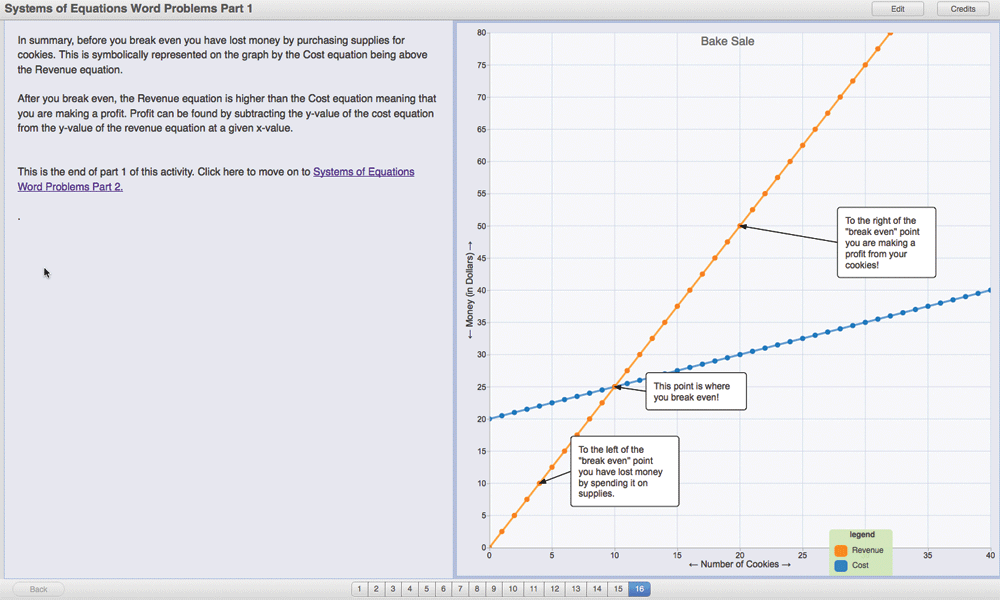
Constructing lines based on equations is a common task in algebra. Figure 2 shows a page in a SmartGraphs activity that helps students understand systems of two equations. Important points or regions on the graph are labeled to help students understand their meaning. Questions posed to students can also require an answer in the form of a label the student constructs on a graph.
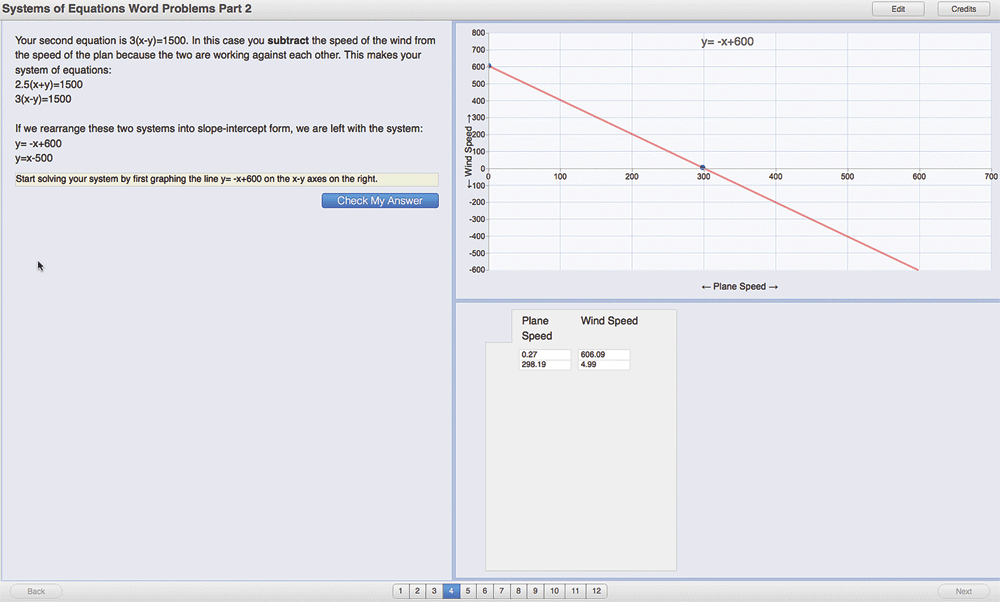
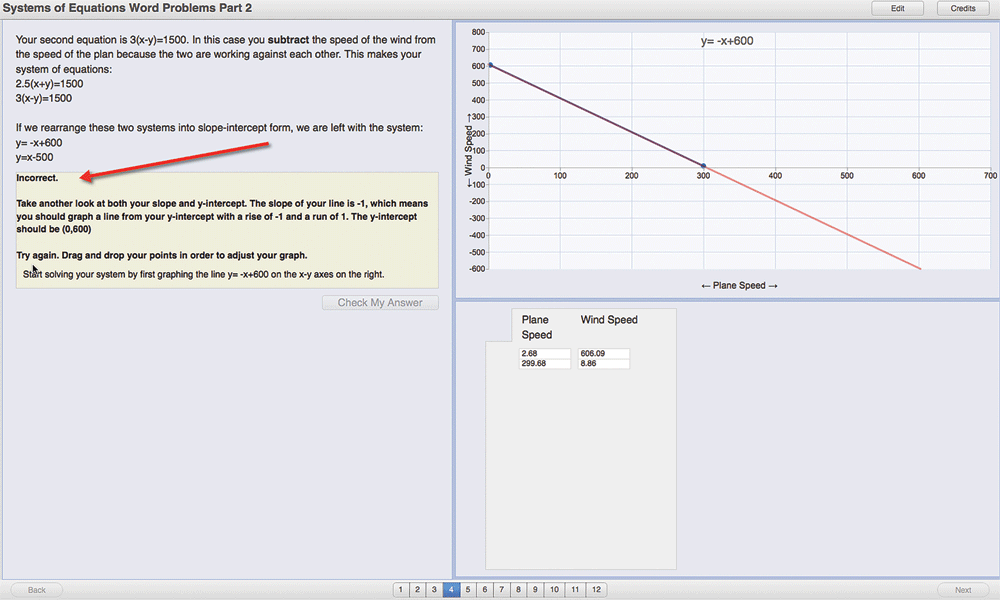
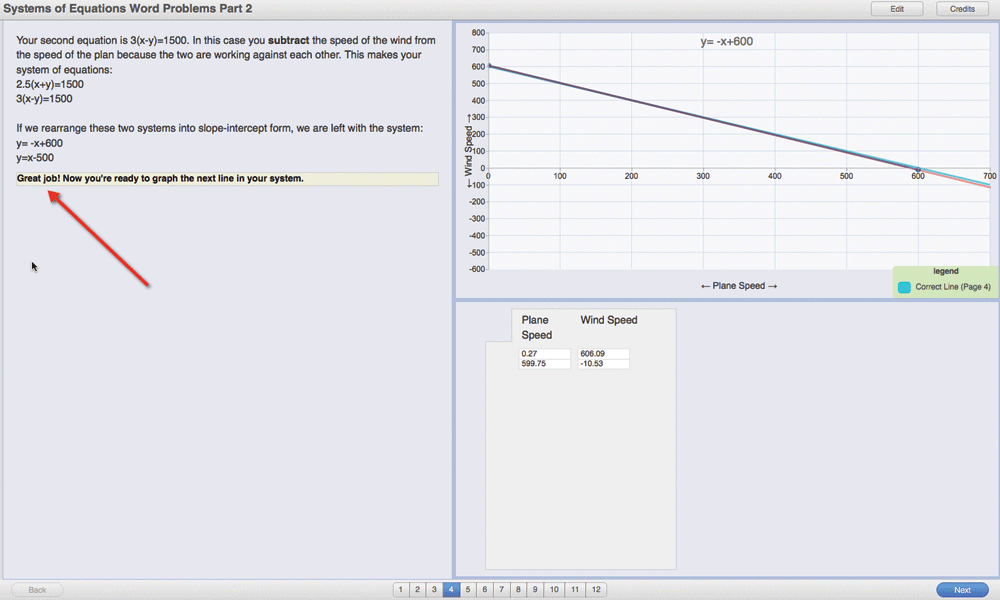
In another algebra activity, students are asked to construct a line for an equation based on a word problem. Figure 3A shows that a student has constructed the line (by clicking two points, which are then connected by a line) and is about to submit the answer. The software tells the student that the line is not correct and provides hints (Figure 3B). (The author of the activity can allow any number of trials for the student.) When the student tries again, the software recognizes the student’s line is now correct (Figure 3C). This is one of many ways in which students can interact with a graph using SmartGraphs.
Deeply digital textbooks
Publishers have the opportunity to embed meaningful and interactive content into a new breed of digital textbooks. We hope that SmartGraphs and other tools become part of a new generation of deeply digital texts that provide practice problems, hints, tutorials and scaffolding.
Andy Zucker (azucker@concord.org) co-directs the SmartGraphs and Graph Literacy projects.
Carolyn Staudt (cstaudt@concord.org) co-directs the SmartGraphs and Graph Literacy projects.
This material is based upon work supported by the National Science Foundation under grants DRL-0918522 and DRL-1256490. Any opinions, findings, and conclusions or recommendations expressed in this material are those of the author(s) and do not necessarily reflect the views of the National Science Foundation.
