Category: Tag: Data sonification
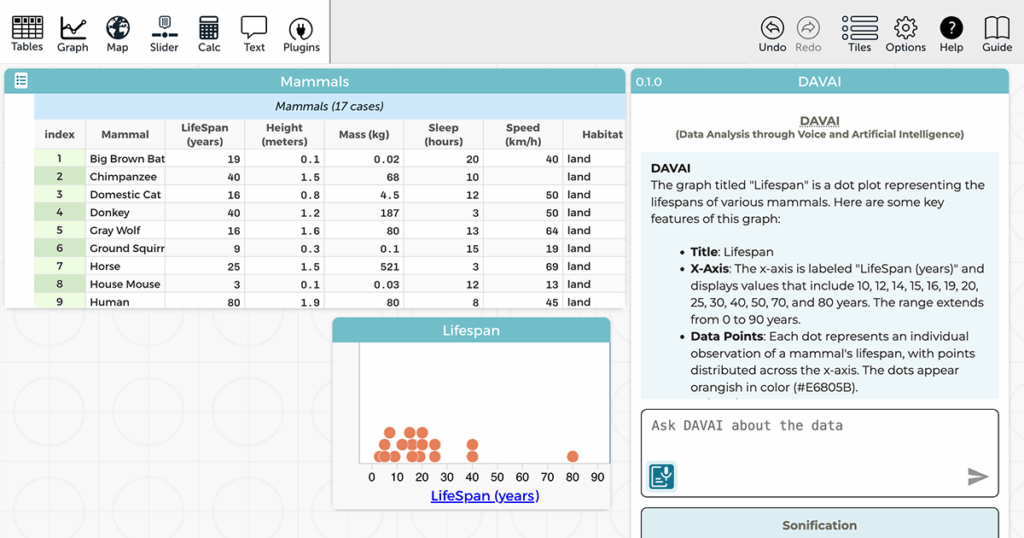
Our Common Online Data Analysis Platform (CODAP) engages learners in data science practices, including data analysis and visualization. But what does “visualization” mean to blind or low-vision (BLV) learners? A new National Science Foundation-funded project is using artificial intelligence (AI) to develop and research new tools for making data exploration accessible to BLV learners. Graphs—and […]
Visual analytics provides a powerful way for people to see patterns and trends in data by visualizing them. In real life, we use both our eyes and ears. So can we hear patterns and trends if we listen to the data?I spent a few days studying the JavaScr…
