Supporting Reasoning with Multidimensional Datasets
Importance
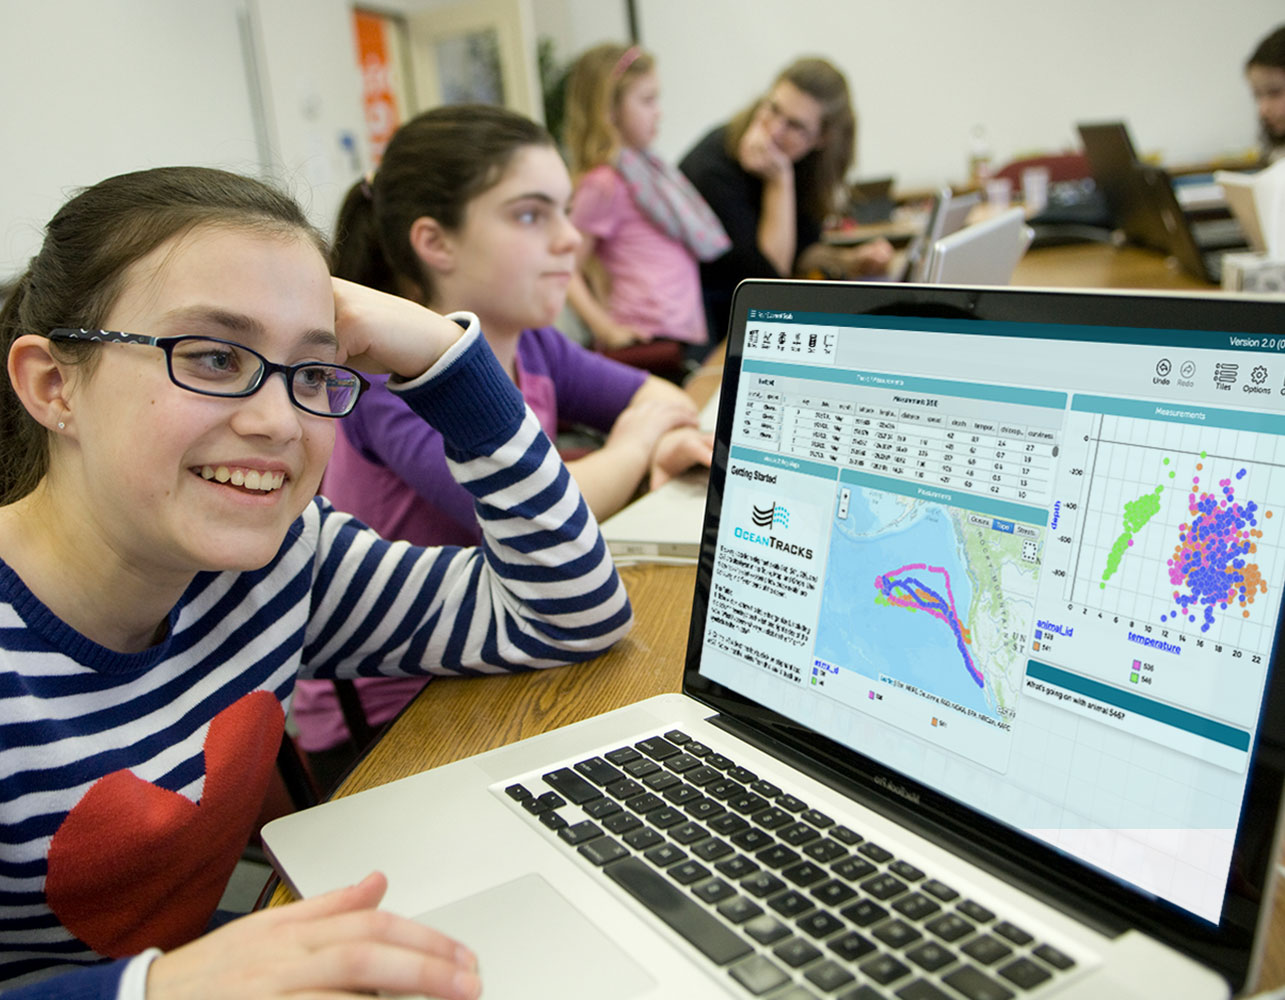
It is increasingly vital that people make sense of scientific data and extract information from public datasets in order to inform their decisions about everything from ballot initiatives on climate policy to personal choices about vaccines. Hierarchical (nested) data structures appear throughout public data — for example, census data grouped by counties or experimental runs grouped by control condition — but students typically encounter data that are formatted only in simple “flat” displays of rows and columns.
We will explore how students and experts work with complex, hierarchical data, which can require the use of multiple data moves such as filtering, grouping, summarizing, and merging. Our goal is to investigate how students can best be supported to represent, interact with, and make sense of such multidimensional data as they seek to understand and reason with those data.
These efforts will include exploring ways to provide more intuitive supports for visualizing and working with complex datasets and simple ways for participating in collaborative data production using CODAP (Common Online Data Analysis Platform). We will produce design principles to guide technology developers, curriculum developers, and researchers in creating environments more conducive to promoting data literacy for all learners, including those interested in further work in STEM and those who are not confident math learners.
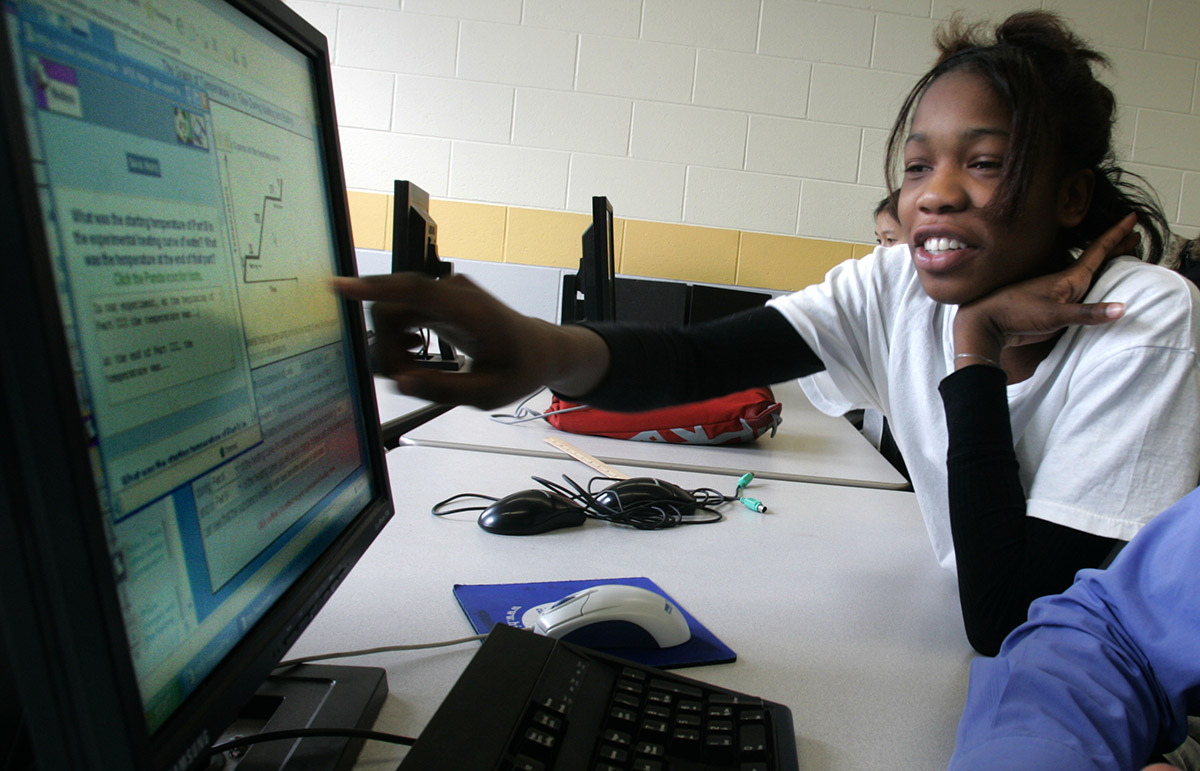
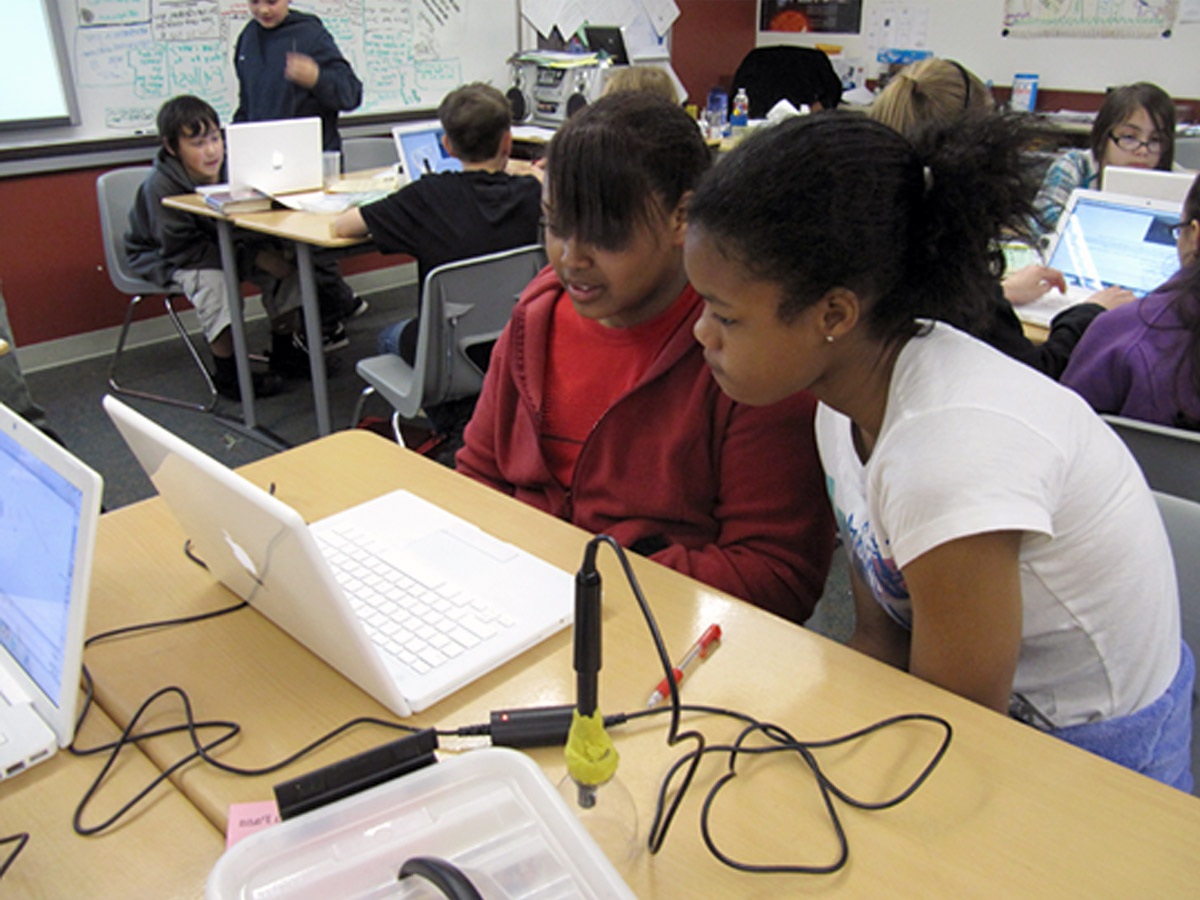
We will ask data experts to think aloud as they make sense of unfamiliar datasets and explain how they interact with the data. This preliminary study will serve as a backdrop to working with individual and small groups of high school students in laboratory settings who will construct complex collaborative datasets by producing their own data and grouping their data with data from other students. We will explore how to build on students’ novice intuitions to better support them in developing more powerful, expert-inspired strategies.
Research
Using qualitative analysis, we will investigate the following questions:
- What sorts of questions do experts in data analysis ask themselves when trying to make sense of an unfamiliar multidimensional dataset? What data moves do they use?
- What are students’ intuitive ways of representing multidimensional datasets?
- What design features of data analysis tools facilitate the representation and exploration of multidimensional datasets?
- What pedagogical strategies and activity structures support student production and analysis of their own multidimensional datasets?
- To what degree does engaging students in the production and analysis of their own datasets support their ability to make sense of multidimensional secondhand datasets?
Publications
- Stephens, A. L. (2025). Troubleshooting as an inquiry activity: Recognizing and supporting the mangle in the classroom. Science Education. https://doi.org/10.1002/sce.21979
- St. Clair, N., Stephens, L., & Damelin, D. (2024). Navigating multidimensional data structures: Insights from data experts and implications for pedagogy. In Proceedings of the 18th International Conference of the Learning Sciences - ICLS 2024, pp. 626-633. International Society of the Learning Sciences. (Winner of the ICLS Long Paper.)
- Dorsey, C. (2024). New data types and new data interfaces. @Concord, 28(1), 4–6.
- Stephens, A. L. (2024). From graphs as task to graphs as tool. Journal of Research in Science Teaching, 61(5), 1206–1233. https://doi.org/10.1002/tea.21930
- Damelin, D., & Blagg, L. (2023). Under the hood: New CODAP plugin displays hierarchical data. @Concord, 27 (1), 14.
Blog Posts
Learn more about the MultiData project at the Concord Consortium blog.


