Alaskan Students Profile Their Local Beach
Alaska has over 6,600 miles of coastline, or nearly 34,000 miles if you include islands and their shorelines as well. By any measure, that’s a lot. The coastline is critical to Alaska’s Indigenous students and their families who rely on the ocean for subsistence practices of hunting, fishing, and gathering traditional foods. The goal of our Precipitating Change project is to provide opportunities for students to learn more about the coast using both Indigenous and Western science approaches and to share their new understandings and stories with their communities.
We collaborated with teachers to create an alternative format for activities in our online learning management system. We wanted to offer students a more open-ended learning experience to record their observations rather than a linear sequence of online activity pages and typical multiple-choice questions. Designed to look like a spiral notebook with tabs for sections, the new online logbook invites student-led inquiry (Figure 1). Students can upload images, create drawings, and type their notes, including through audio recordings. The logbook also contains traditional curriculum activities, such as videos (e.g., of Elder interviews and coastal protection strategies), models of wave motion such as during a storm surge, real-world data, an interactive glossary, and more.
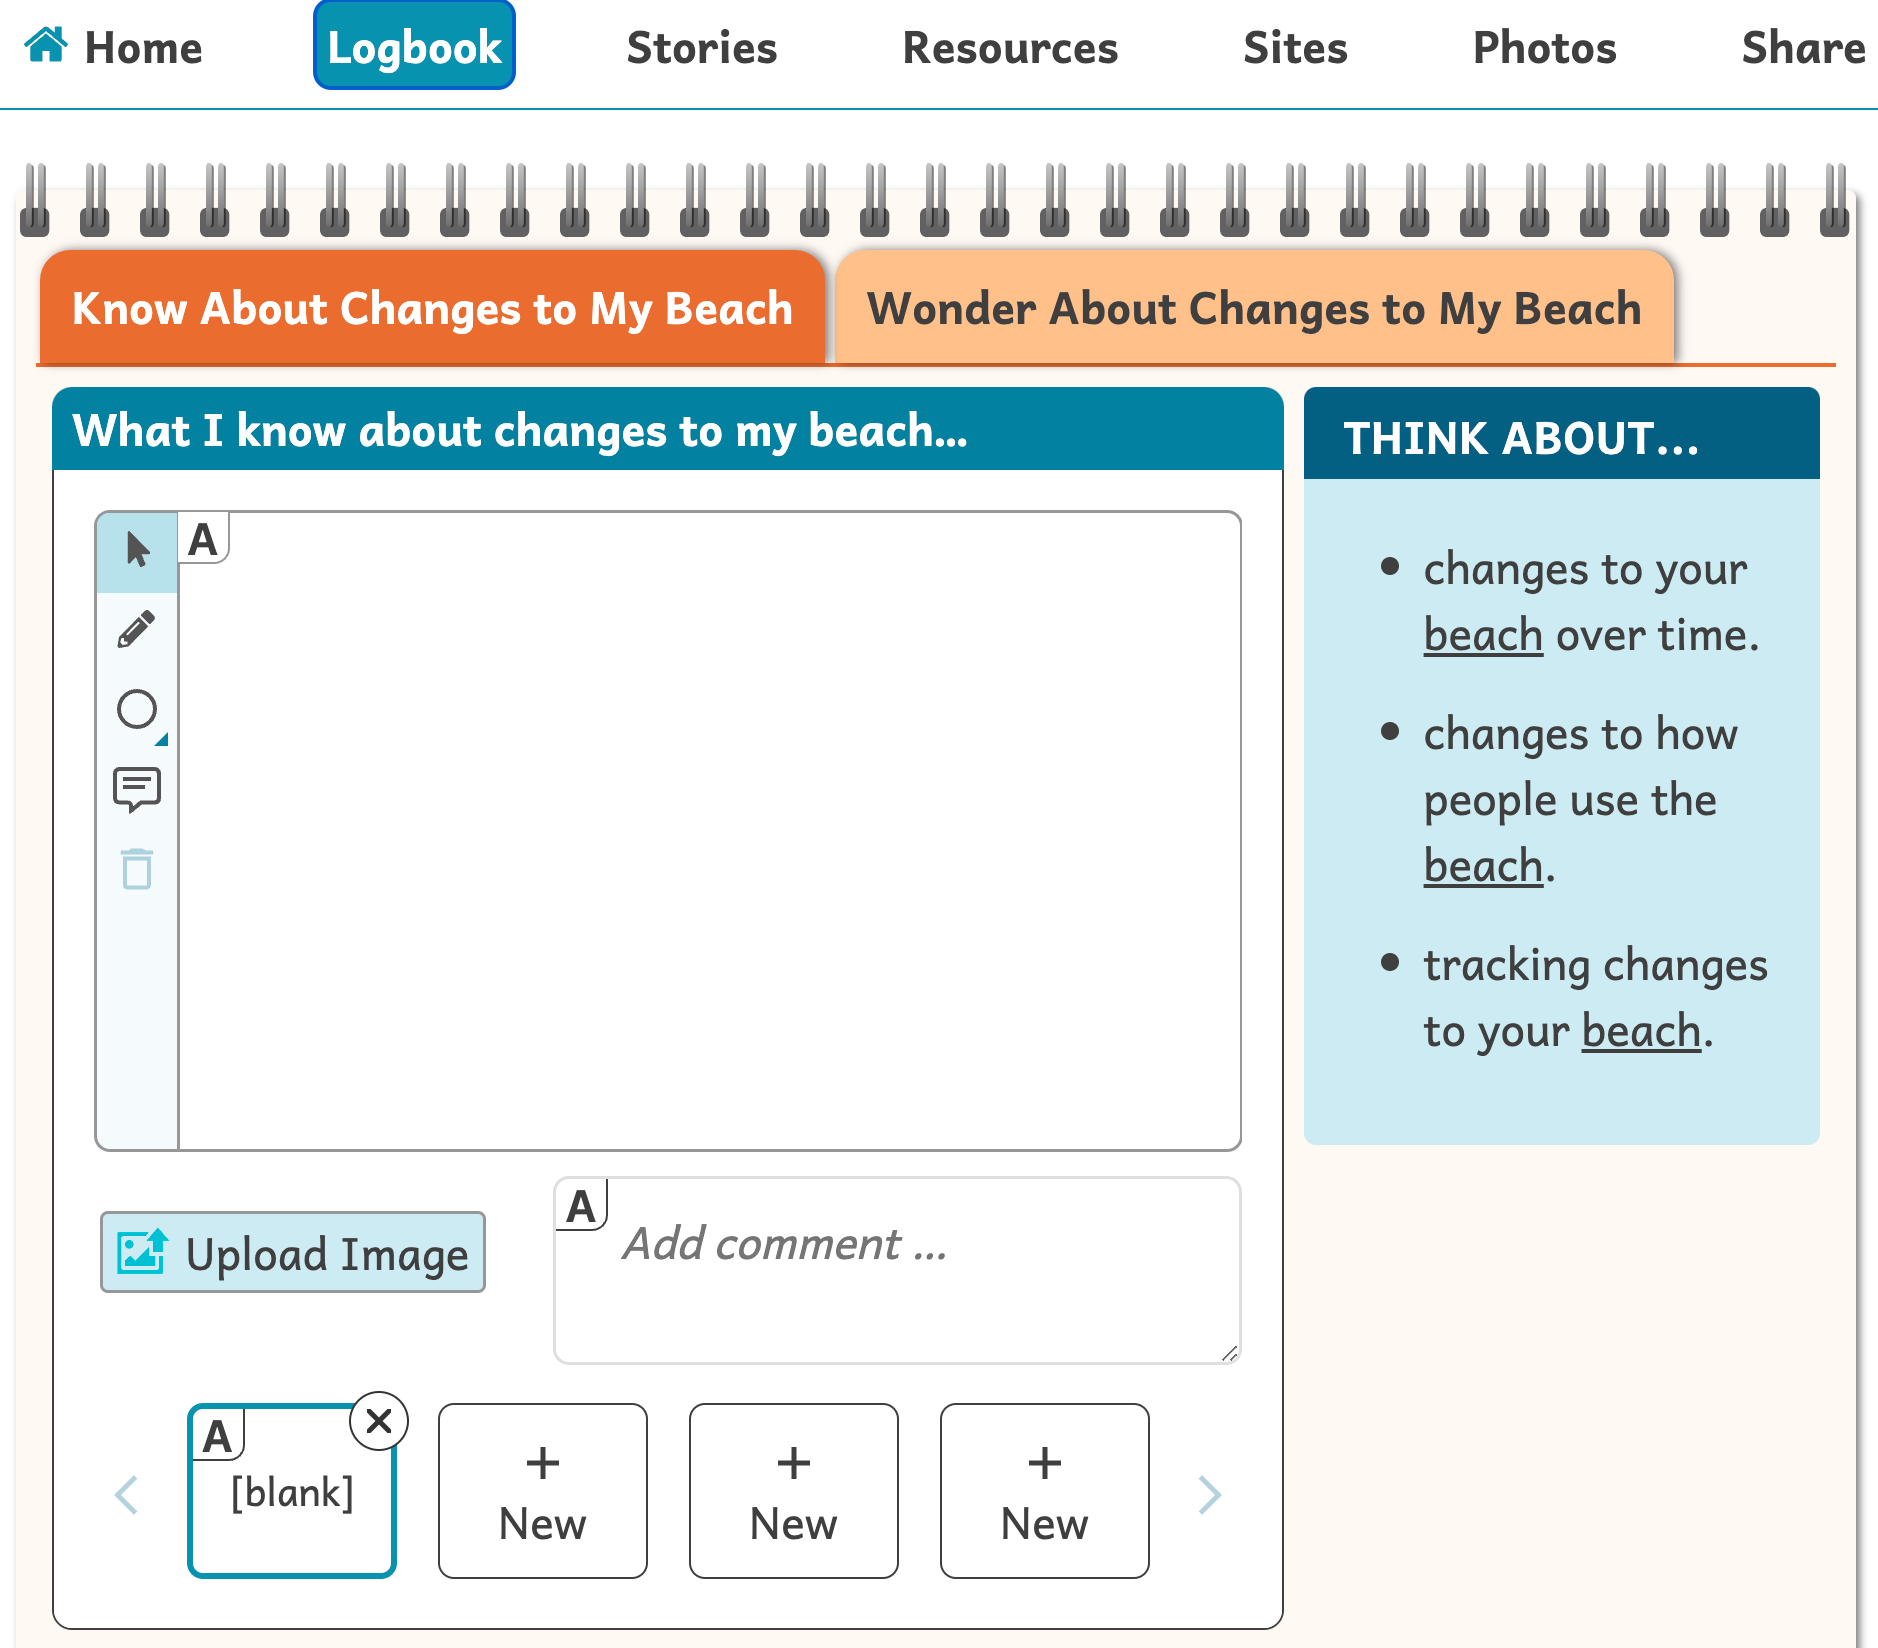
Throughout the logbook, students are prompted with special “think about…” sections. For example, students are asked to think about their experiences harvesting food from the ocean; the impact of climate change on the food supply for their village; stories from parents, community members, and Elders about changes to the beach; and adaptations they would recommend for their beach. In this hands-on, place-based curriculum, students are encouraged to get outside and get involved in their communities. To investigate how their coast is changing, for example, students visit their local beaches, take measurements of the height and slope of the sand and shore, and analyze their data using tools and methods similar to those used by coastal geologists.
Data collection
We developed an online data analysis tool called the Beach Profile Grapher, which allows students to input data about their local beach, compare their data with data collected in prior years, and look for evidence of change. Using this online tool in combination with the physical collection of data provides a powerful experience of monitoring and modeling places that are important to students.
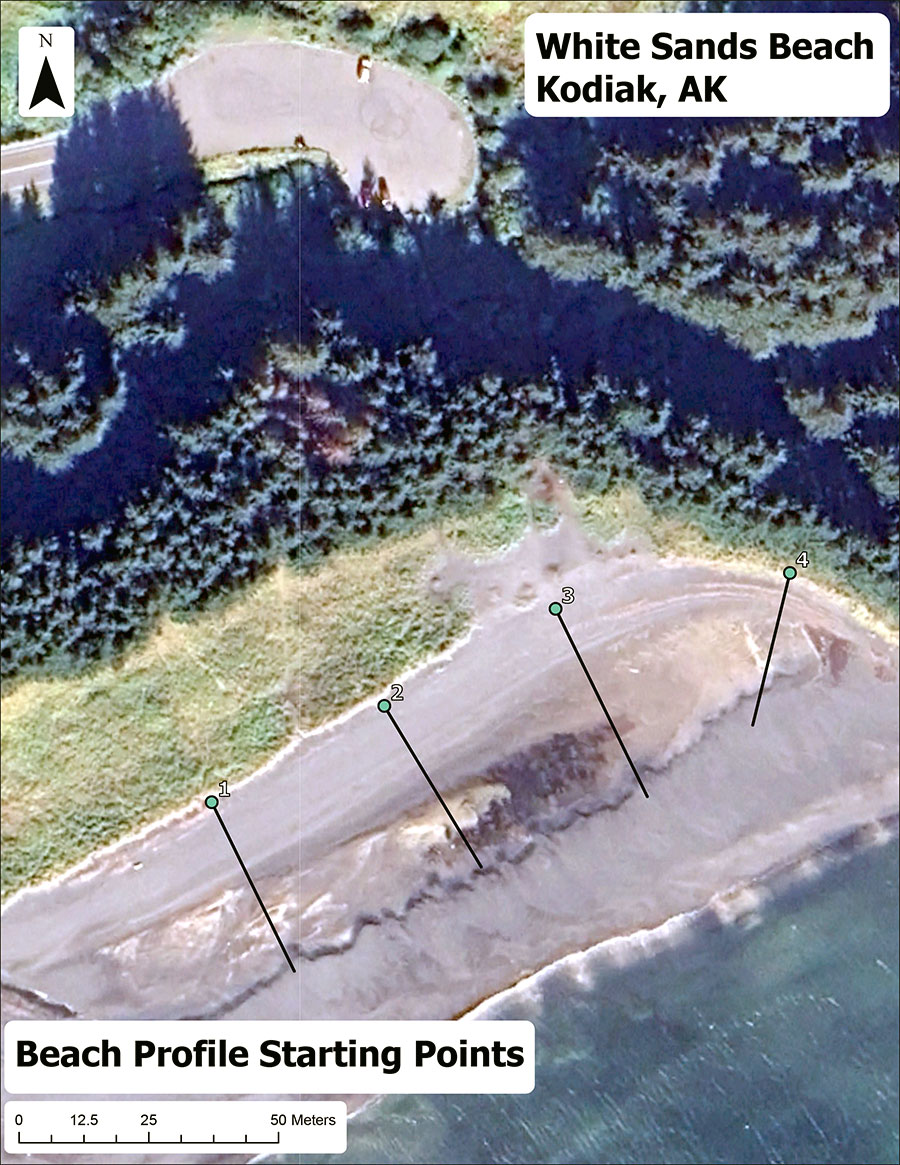
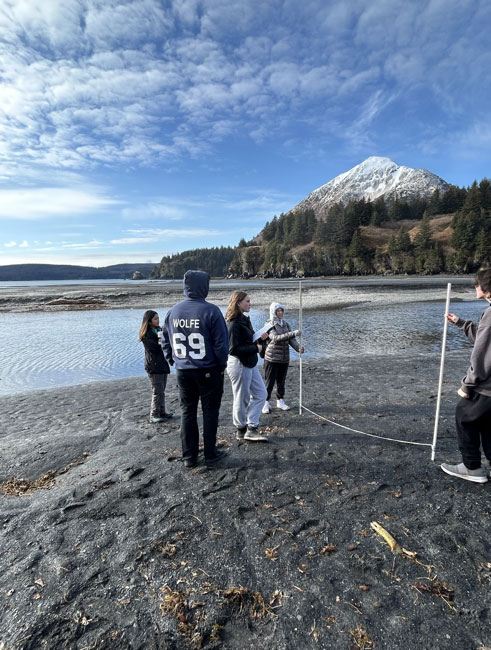
At one study site on the northern coast of Kodiak Island, Alaska, students gathered data on White Sands Beach. A class of 25 eighth grade students used a GPS device and a georeferenced map of the beach, marked with four straight-line paths (called transects) highlighted along the beach (Figure 2). The transects matched those measured by scientists from the University of Alaska Anchorage (UAA) during the prior year (Figure 3).
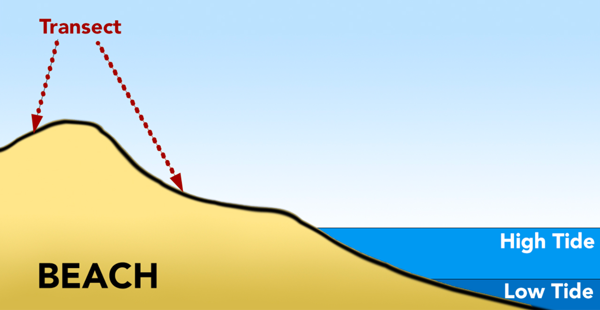
Students used the Emery Method to create a profile of White Sands Beach, recording the change in elevation along each transect of the beach (Figure 4). Using this method, they placed one rod (the landward rod) at the starting point of the transect and moved a second rod (the seaward rod) towards the ocean two meters away. The student holding the landward rod aligned the horizon and the top of the lower of the two rods, and recorded the change in elevation between the two (Figure 4). Next, students moved the landward rod to the position of the seaward rod, then moved the seaward rod toward the water and took new measurements. They repeated the process until the beach was profiled along each transect.
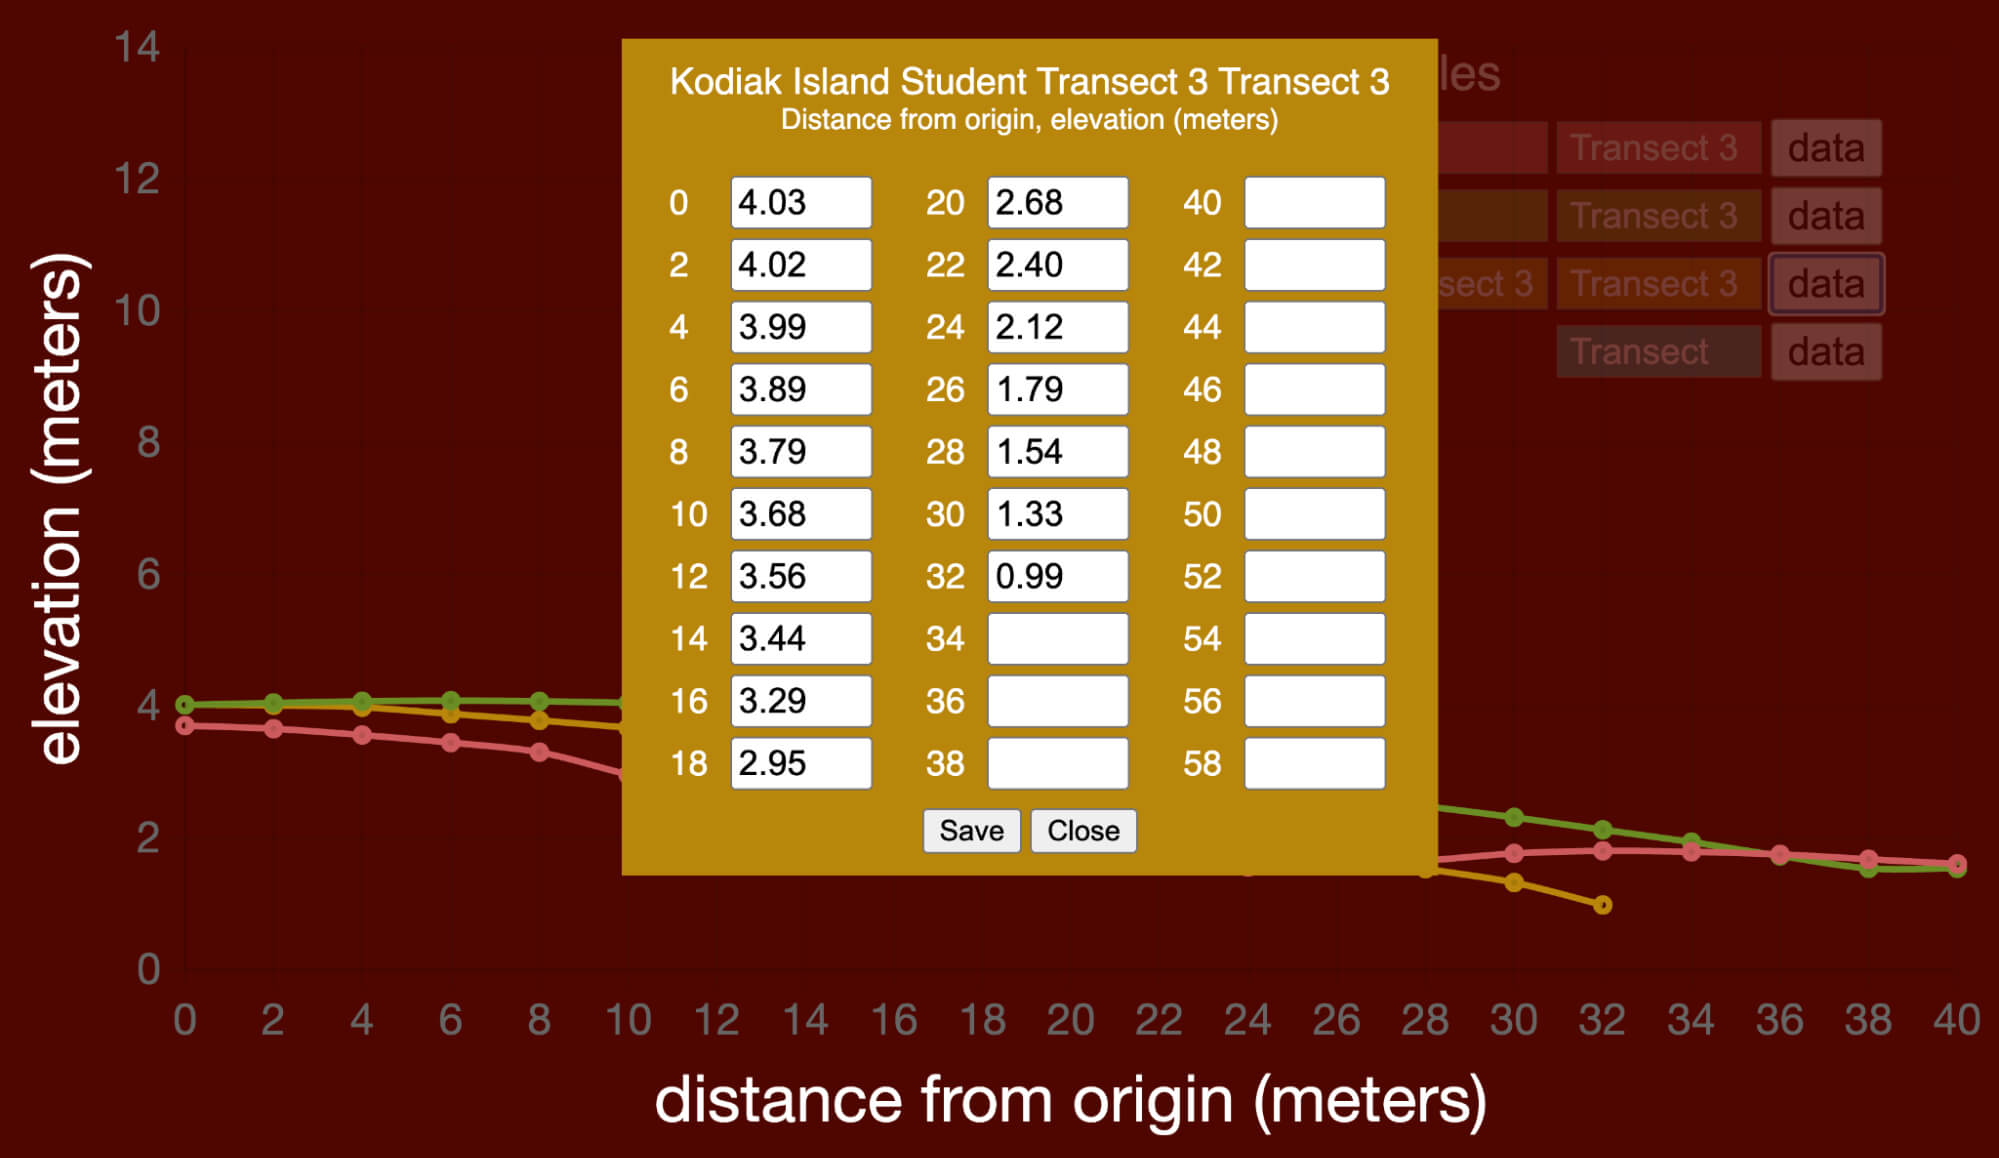
After student groups collected elevation change data at each of the four transects, they uploaded their data to the Beach Profile Grapher (Figure 5) in order to create, view, and compare line graphs of the elevation of a beach cross-section. The Beach Profile Grapher included pre-loaded data collected by the UAA survey team for five beaches in Alaska from 2018 to 2024. By overlaying graphs of the data the students collected with the UAA data, students were able to determine if White Sands Beach had been building or eroding along the same transect and if the beach was steeper or flatter along different transects.
Results
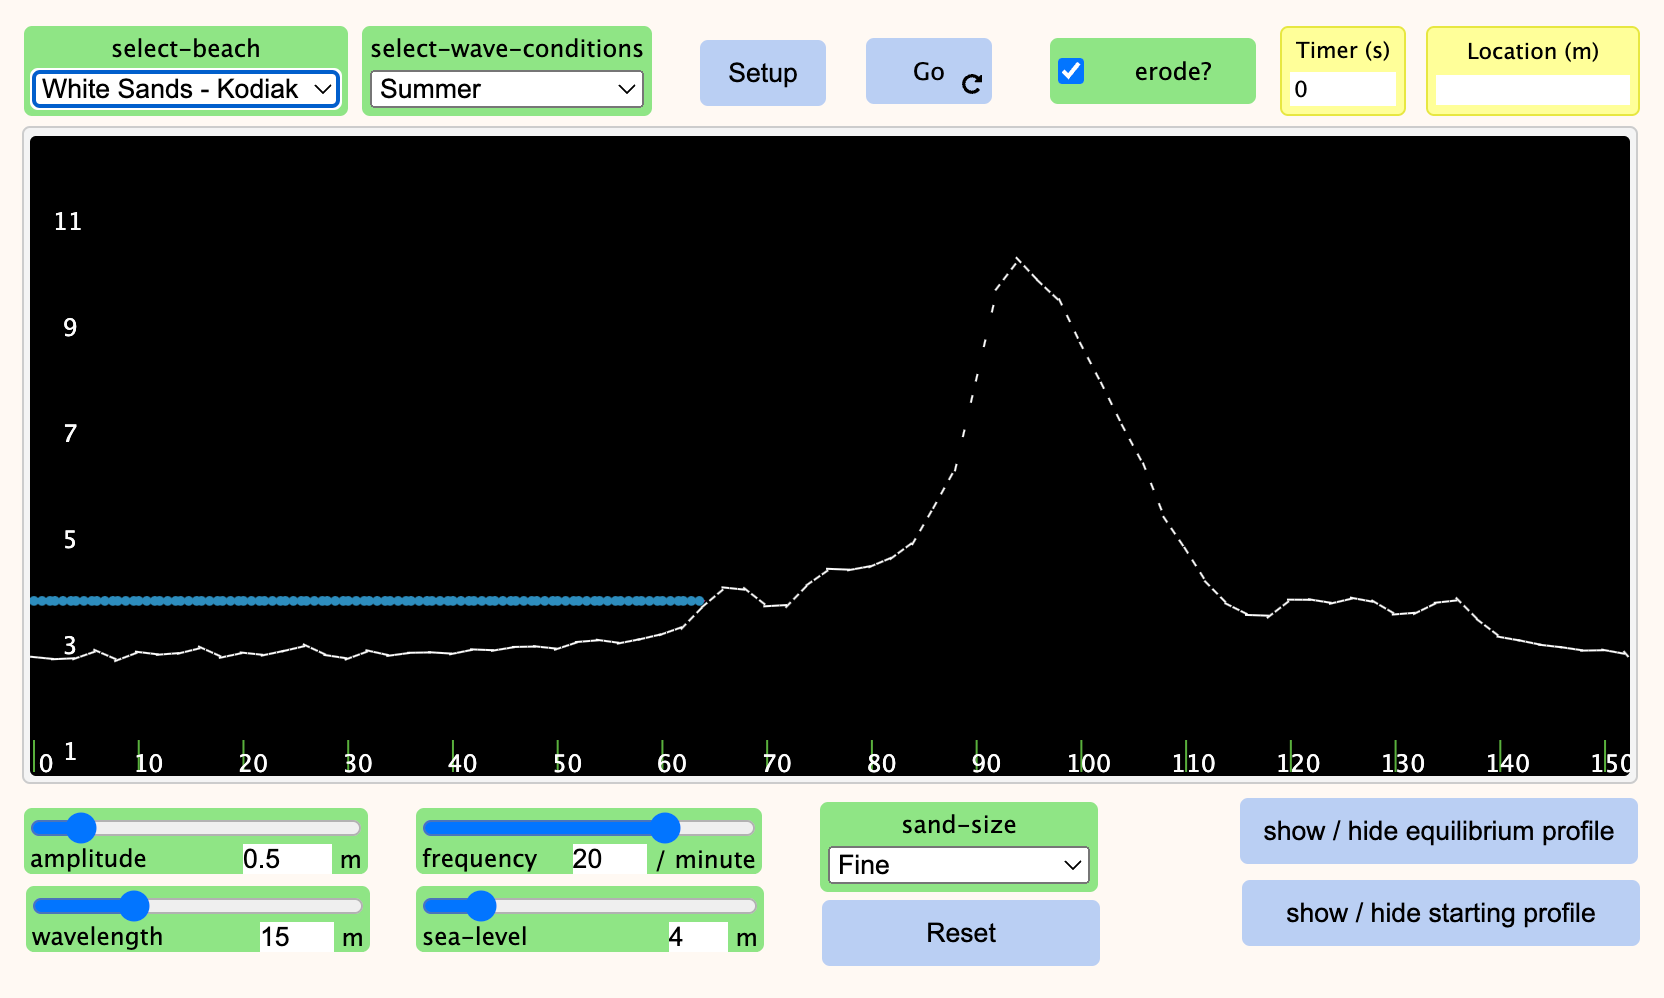
As a result of their work, the students saw that a cross-section of beach had been building up since 2019, yet in 2023 it had begun eroding. They discussed potential causes including recent storms, such as Typhoon Merbok, which hit Hooper Bay, another Alaskan classroom site, in September 2022. They also used computer simulations to model different scenarios and storm events (Figure 6). Students learned about coastal erosion mitigation strategies such as hard protection (concrete seawall) and soft protection (dune restoration), and asked their Elders and other community members what had worked in the past and what might work in the future. At the conclusion of the unit, students shared their data, alongside their observations, reflections, logbook notes, and stories of their beach with their community, including through song, dance, and video.
By providing meaningful activities that allow students to do the work of scientists and track how their coast is changing, the Precipitating Change unit helped students leave their own legacy. Future classes can use their data—and their stories—as resources and reference points to continue to study coastal change on their beaches.
Joy Massicotte (injoy5683@gmail.com) is a curriculum designer and consultant.
Tom Moher (moher@uic.edu) is an Emeritus Associate Professor at the University of Illinois at Chicago.
Carolyn Staudt (cstaudt@concord.org) is a senior scientist.
This material is based upon work supported by the National Science Foundation under Grant No. DRL-2101198. Any opinions, findings, and conclusions or recommendations expressed in this material are those of the author(s) and do not necessarily reflect the views of the National Science Foundation.
