
Monday’s Lesson: When Disaster Strikes
The Earth is always quaking and shaking. Movement of Earth’s tectonic plates causes approximately 20,000 earthquakes around the globe each year. Fortunately, most earthquakes are so small that they go unnoticed, but some are large and dangerous. Major earthquakes, like the recent ones in Iceland, often make the headlines, even halfway around the world. Students are understandably intrigued and can come to science class with lots of questions. Why do quakes always seem to happen in the same locations? Are we at risk for an earthquake?
Our Seismic Explorer data visualization tool plots earthquakes on a map of the Earth, allowing students to see both large and small earthquakes, compare recent seismic activity to the past, and examine plate boundaries. The data in Seismic Explorer, including the location, depth, and magnitude of each earthquake, from the U.S. Geological Survey, is updated daily. Use Seismic Explorer to investigate earthquakes from 1980 to the present, or focus your inquiry on more recent quakes.
1 Open Seismic Explorer
Go to seismic-explorer.concord.org
Run the model and watch as earthquakes are displayed on the world map.
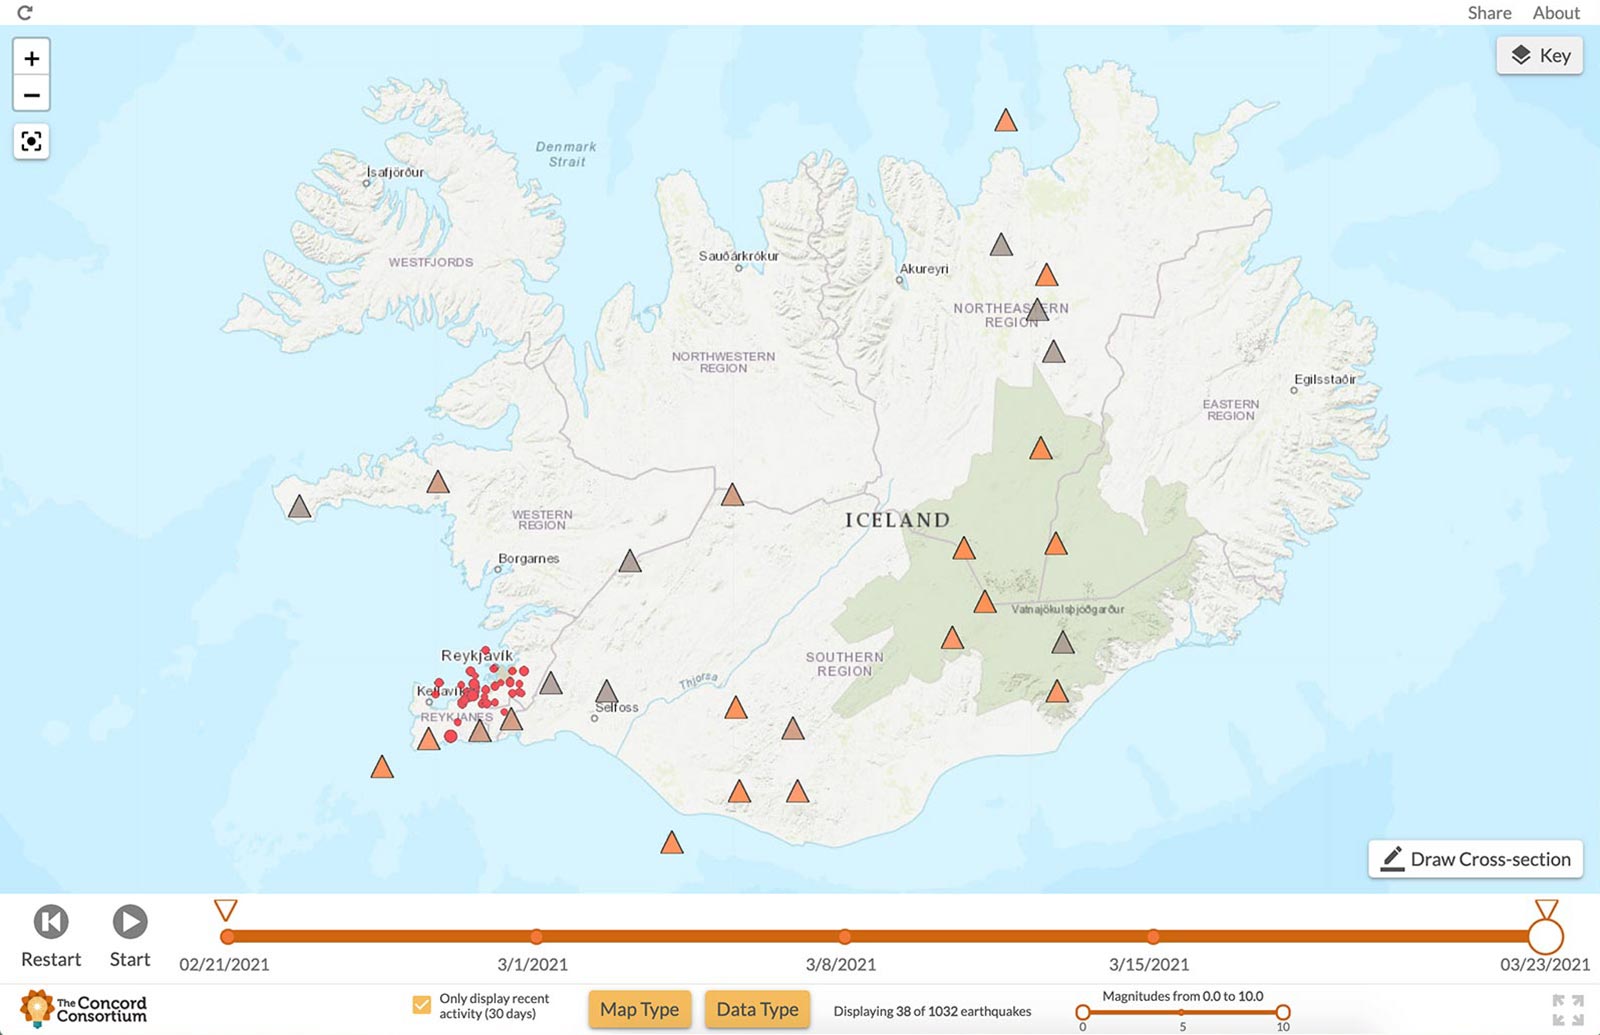
To narrow down the timeline to seismic activity in the last month, click the “Only display recent activity” checkbox, which sets the model to show the last 30 days. Click the “Data Type” menu to view earthquakes, volcanoes, or both (Figure 1). Run the model again.

2 Find the earthquake
When the model is running, colored dots representing earthquakes appear. As shown in the online key, the size of each dot represents the magnitude (size) and the color represents the depth of the earthquake’s epicenter. To locate a specific earthquake on the map, switch to Street in the “Map Type” menu to identify countries and zoom into areas of interest. Drag the sliders on the timeline to focus on a time range.
3 Discover patterns
Ask students to think about the location of the earthquake under study. Is it on land or in the water? Is it near other earthquakes? Note that 30 days of data may not be enough for students to observe the telltale lines of earthquakes and volcanoes that reveal plate boundaries. Deselect the recent activity checkbox and run the model again to show over 40 years of activity. Turn on volcanic eruptions to look for patterns in both earthquake and volcanic activity, explore the edges of plates, and think about connections to nearby landforms.
4 Dig deeper
Ask students to identify the type of plate boundary nearest to the earthquake by taking a closer look at the location and distribution of earthquake dots. The depth of earthquakes provides evidence for the type of plate boundary at that location. Draw a cross-section to investigate earthquakes both at and below the surface. Notice the diving pattern of earthquakes from shallow to deep at a subduction zone or the multiple surface earthquakes at a divergent boundary. To verify the locations of plate boundaries, check Plate Boundaries in the “Data Type” menu, then use the key to identify boundary types (convergent, transform, and divergent).
Looking for more?
Created by our Geological Models of Exploration of Dynamic Earth (GEODE) project, Seismic Explorer has been embedded in a two-week plate tectonics curriculum unit for middle and high school classes. Students explore data about plate boundaries, make connections to Earth’s past, and make predictions about what Earth may look like in the future.
Trudi Lord (tlord@concord.org) is a senior project manager.
This material is based upon work supported by the National Science Foundation under grant DRL-1621176. Any opinions, findings, and conclusions or recommendations expressed in this material are those of the author(s) and do not necessarily reflect the views of the National Science Foundation.