
Can We Feed a Growing Population? Using Simulations to Engage Students
We live in a changing and dynamic world where so much takes place outside the science classroom. Energy flows, water cycles, clouds form, and plants grow. My students want to know what’s happening, especially with phenomena they can’t see for themselves. For instance, when I teach about land uses in my high school Earth science class, my students are often confused that soil changes over time and is affected by human behavior. Models and simulations can help students see what’s happening. So I love the High-Adventure Science module “Can we feed the growing population?” which incorporates models of land use.
We live in a rural part of Kentucky. Questions about land use are both local and real. So I start by asking my students, “Will we always be able to produce enough food to feed everyone?” I listen as they share their thinking about issues that impact local food production, including how human behavior influences land use and the quality of agricultural land. We discuss the shift in the number of acres used for agricultural purposes and how that has affected our economy.
Then we get started with the High-Adventure Science curriculum module. In the first activity, students examine plant growth, using embedded prompts to help scaffold their sense-making of the data. In the first of many “argumentation sets” throughout the module, students make a claim about the relationship between crop yield and soil potassium levels. Then they rate how certain they are about their claim based on the quality of the evidence and write an explanation of this certainty rating. This allows them to evaluate the merits of the evidence.
Before continuing with the next online activity, we spend several class periods collecting and analyzing the physical and chemical properties of the soil on our school campus, including the potassium level. Students use this data to make comparisons of their findings and the scientists’ data. This real-world data collection and analysis allows students to deepen their learning, discuss findings, and reevaluate their initial arguments. Students revisit their responses in the first activity, making changes to their arguments as they gather new information. Importantly, they also learn that scientists continually use new evidence to construct and revise explanations.
Exploring different variables
When we return to the module, students examine global land use and discover how soil is formed. The computer model allows students to explore what happens to different landscapes over a period of time as they change variables and compare outcomes for two different land management zones. Students see beyond (and below) the surface as they change the slope of the landscape and note whether plants are present in each zone, and observe time-lapsed graphs of erosion rates and topsoil amounts. Such experiments are impractical or impossible in the real world, where these events are too slow to investigate firsthand or could result in potentially negative outcomes.
Using the model, students simulate several possible scenarios, such as planting vegetation on bare slopes to conserve soil, and gather data to support real-life choices. They can use the model to consider whether or not grass should be planted in a new housing development to prevent soil erosion. For example, in our area, we are witnessing an increase in local residential development and the impact on agriculture production.
Throughout the module, students explore new variables as they are added to the same model. As the complexity of the model increases, students are able to evaluate factors that are difficult to see in daily observations, such as slow erosion and farming practices and their long-term impact on soil quality. They watch as soil erosion is affected by climate factors, including precipitation levels. Students continue to answer questions in the form of argumentation sets. Using claims, evidence, and reasoning, they evaluate the evidence generated in the models to determine which land management practices are best, such as when vegetation presence is most useful and which vegetation type is best.
One of my favorite parts of the class is the full-group discussions. Students bring questions from their own lives and from the curriculum:
- How can the quality of the soil be restored if the same crop has been grown in the same location for many years?
- Does soil erosion affect our local water supply? Do these materials flow into the lake?
- What happens to topsoil that is moved from the site of a subdivision or a new home site?
Students exchange ideas with each other in the same way that scientists do. This kind of discourse is important. It is also the epitome of the Next Generation Science Standards (NGSS) practice of Obtaining, Evaluating, and Communicating Information.

Monitoring student progress and learning
To assess student understanding, I use the pre-test and post-test included with the module. Rubrics for explanations and certainty ratings allow my students to self-assess and assist me in providing feedback. Other embedded tools allow me to monitor student progress and learning. I can check individual student performance and whole-class progress at a glance using the Teacher Dashboard to access students’ responses to embedded questions and their saved models. Individual student reports allow me to check student understanding while reports on specific questions allow me to determine where the entire class is in their thinking. This enables me to identify misconceptions, ask clarifying questions, and determine what my students need to support their understanding.
The Teacher Portal also allows me to provide student feedback. Students access the feedback when they log into the module, and use it to examine their thinking and revisit portions of the curriculum. They edit their responses as new learning occurs. As students complete the module, I compare their pre- and post-test responses to determine their level of understanding.
Conclusion
“Can we feed the growing population?” helps students understand the human impacts on food production. But it does so much more. Students run simulations, examine evidence, and discuss their findings with each other—in the same way that scientists and researchers do—while engaging in many of the NGSS science and engineering practices, especially Developing and Using Models and Engaging in Argument from Evidence. Students evaluate the strengths and limitations of models, predict relationships between components of a system, and make and defend claims based on evidence about the natural world.
I’ve been teaching with High-Adventure Science for seven years. These curriculum modules have helped my students understand the value of scientific modeling and become more capable in constructing scientific arguments, giving them the tools to answer questions about the world around them.
Stephanie Harmon (stephanie.harmon@rockcastle.kyschools.us) is a teacher at Rockcastle County High School, Mount Vernon, KY.
Sarah Pryputniewicz (spryputniewicz@concord.org) is a research assistant.
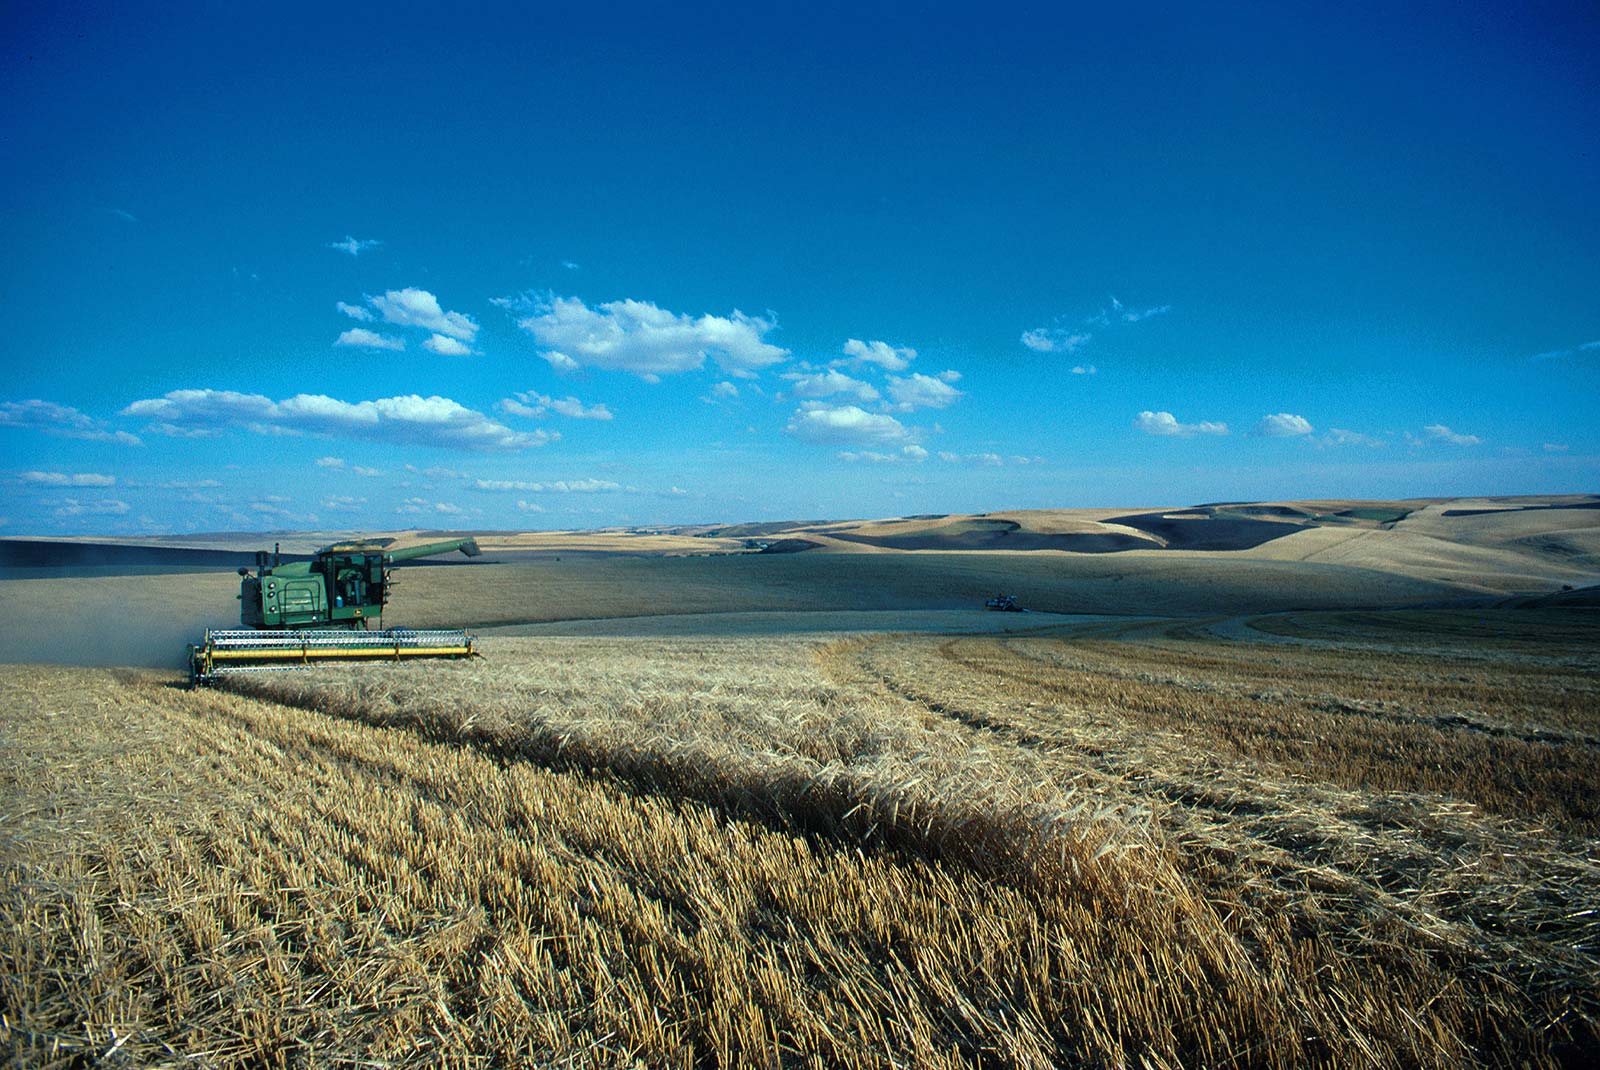
Photo credit: U.S. Department of Agriculture
This material is based upon work supported by the National Science Foundation under grant DRL-1621176. Any opinions, findings, and conclusions or recommendations expressed in this material are those of the author(s) and do not necessarily reflect the views of the National Science Foundation.