BigData
Importance
Engineering design is a complex cognitive process in which students learn and apply science concepts to solve open-ended problems with constraints to meet specified criteria. The complexity, open-endedness, and length of an engineering design process often create a large quantity of student data that makes learning difficult to discern using traditional assessment methods. We’re developing process analytics to make sense of that data.
For example, a pattern that looks like “gaming the system” in an inquiry activity may be a legitimate search in a vast problem space for meaningful alternatives in a design project. An idea that sounds ridiculous initially may lead to the most creative design at the end. Students may learn more from failed designs than from successful ones because failure promotes the need to explain and revise.
The focus of engineering design assessment is not simply on whether or not students “get the right answer,” but on how they acquire science and engineering knowledge and skills in the quest for optimal design solutions. Engineering design assessment thus requires innovative solutions that can track and analyze student learning trajectories over a significant period of time. Sophisticated data mining and machine learning techniques originally developed for scientific and business applications provide such solutions.
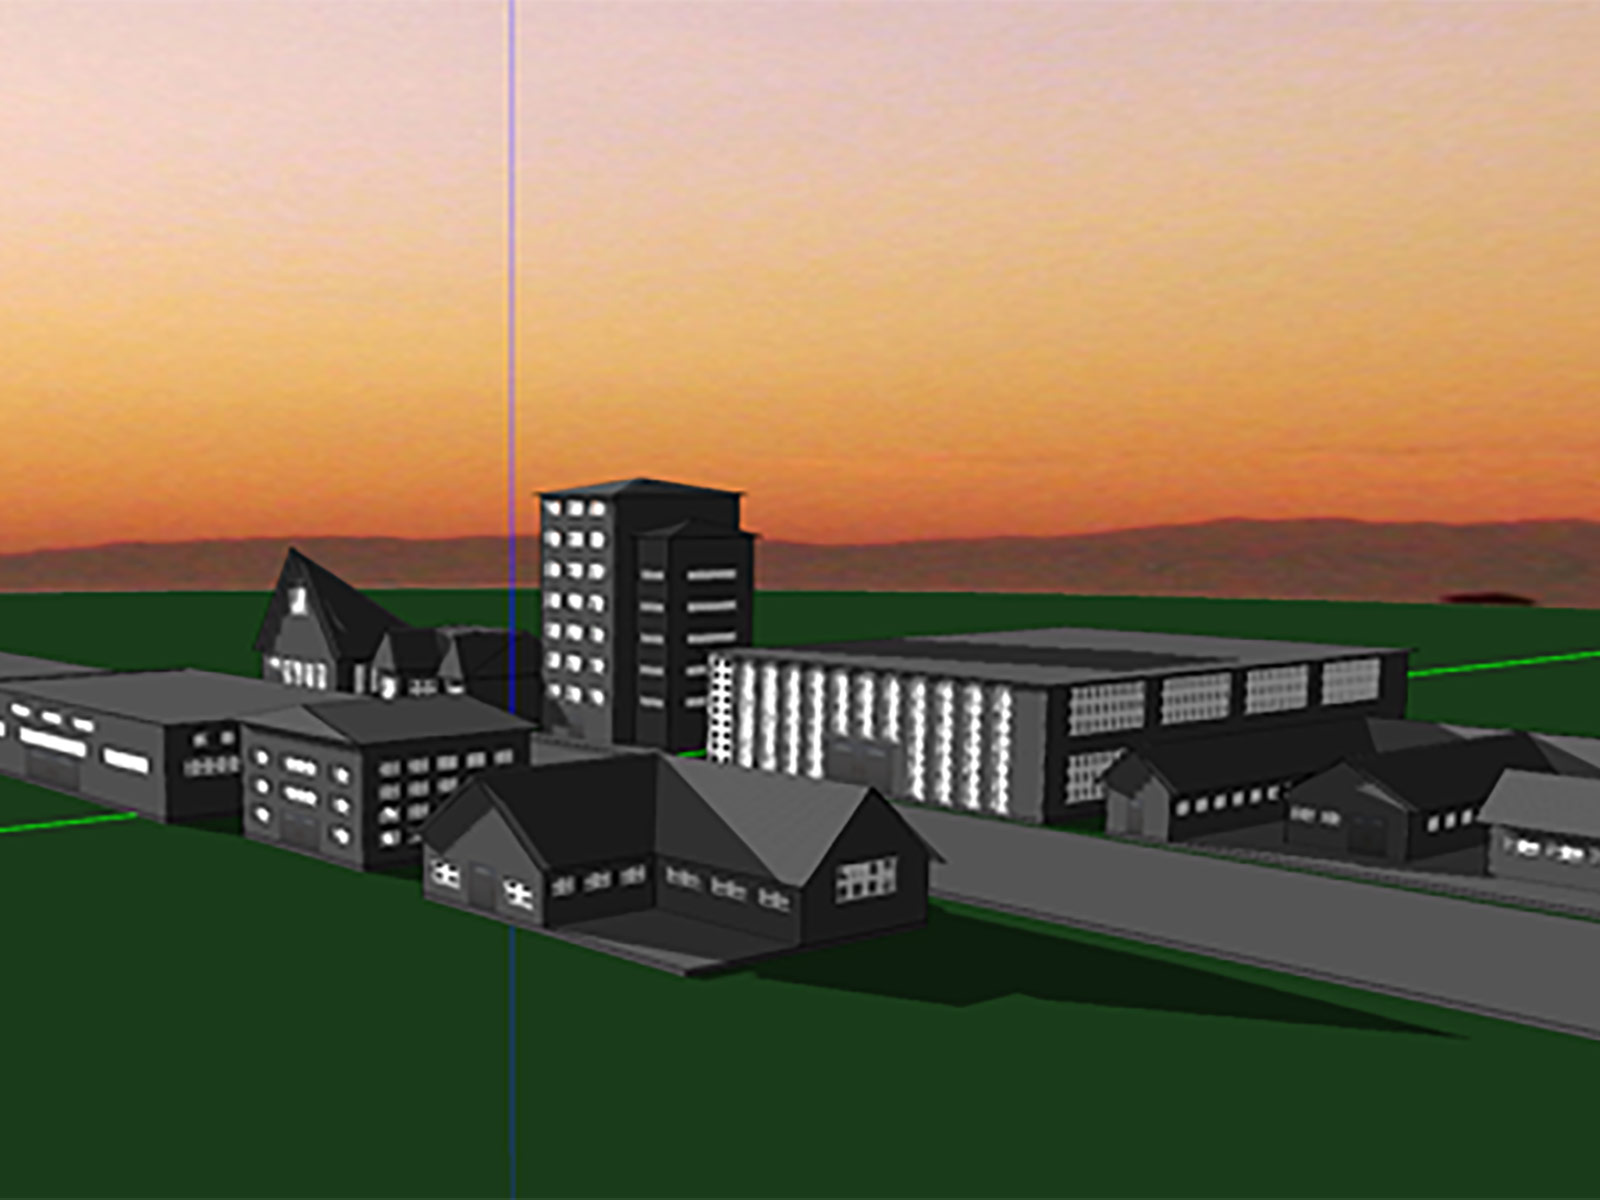
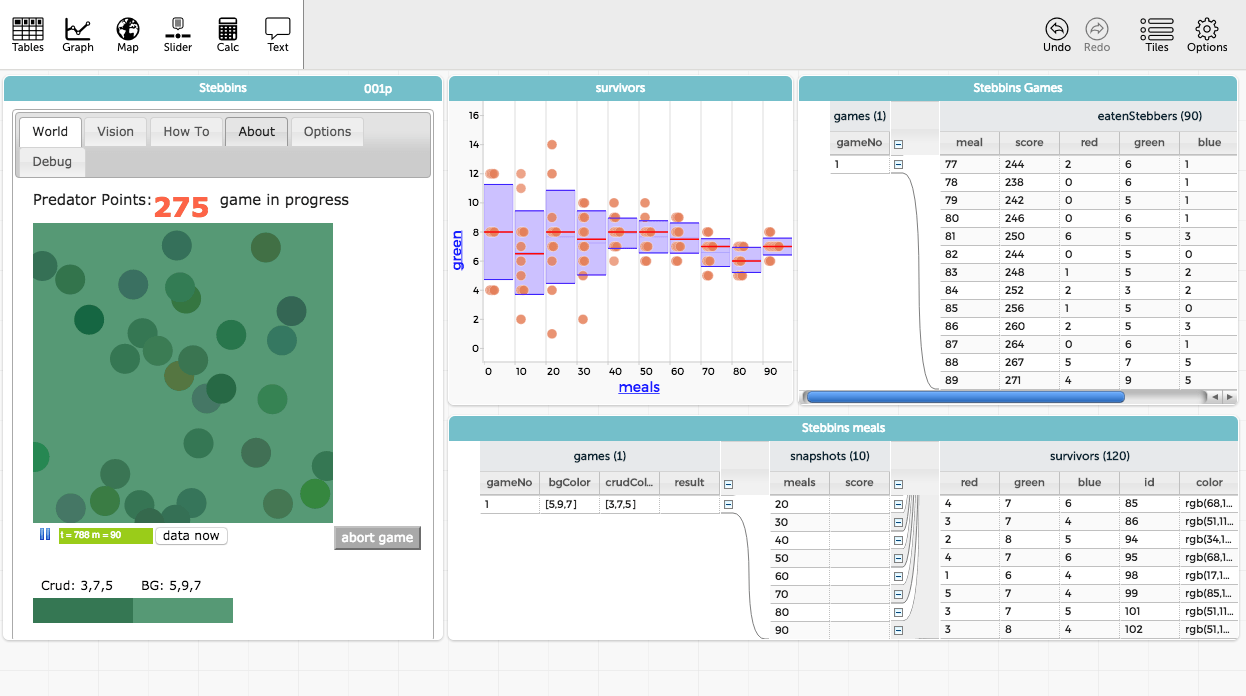
In this research project, approximately 3,000 secondary students will be involved in 6-8 hours of intense design projects using our Energy3D software, producing about 60GB of process data that will become the “gold mine” of educational research on engineering learning. Process analytics based on mathematical and computational models such as time series analysis, graph theory, correlation analysis, Bayesian performance tracing, and so on will be developed to decipher learning patterns in these “big data.”
Research
- We propose a novel computational approach based on time series analysis to assess engineering design processes using a computer-aided design (CAD) tool. Design actions and artifacts are continuously logged as time series by the CAD tool behind the scenes, while students are working on a design challenge. Results suggest that these fine-grained data can be used to measure the level of student engagement, reveal gender differences in design behaviors, and distinguish the iterative and non-iterative cycles in a design process.View Paper
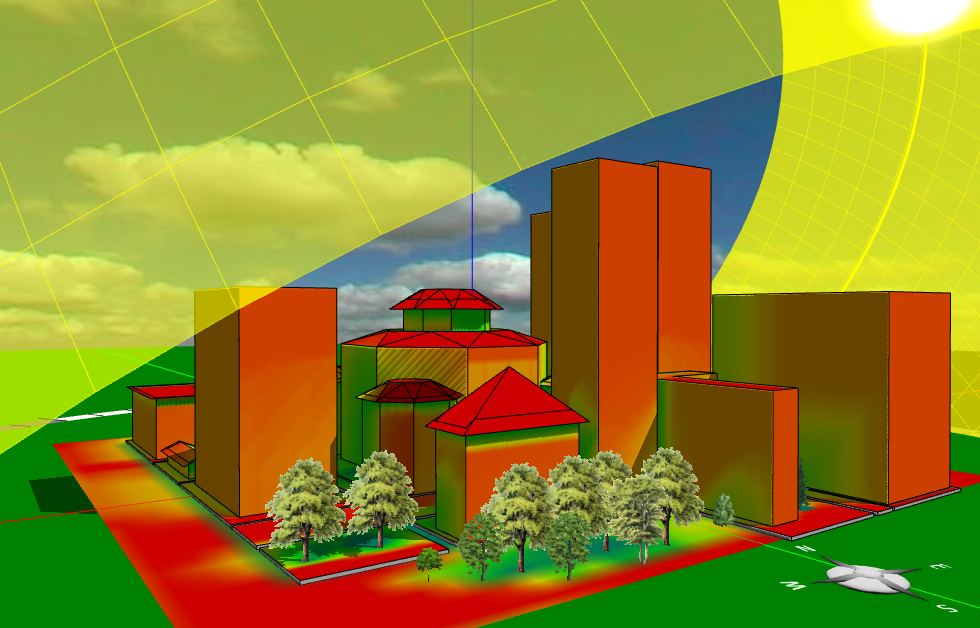
- We analyzed nearly 900 megabytes of process data logged by our Energy3D CAD software as collections of time series. These data were gathered from 65 high school students who solved a solar urban design challenge using Energy3D. Results show that logs from student actions in computer-aided design (CAD) software can be used to quantitatively determine the effectiveness of an intervention for individual students during an engineering design project.
View Paper
Publications
- Xie, C. (2018). Monday’s lesson: Using artificial intelligence to design a solar farm. @Concord, 22(2), 7.
- Xie, C., Zhang, H., Nourian, S., Pallant, A. & Bailey, S. (2014). On the instructional sensitivity of CAD logs. International Journal of Engineering Education, 30(4), 760-778.
- Xie, C., Zhang, H., Nourian, S., Pallant, A., & Hazzard, E. (2014). A time series analysis method for assessing engineering design processes using a CAD tool. International Journal of Engineering Education, 30(1), 218-230.
- Xie, C. (2013, December 6). Large-scale research on engineering design based on big learner data logged by a CAD tool. NSF ECR inaugural meeting, Arlington, VA.
- Zhang, H., Xie, C. & Nourian, S. (2014, June 23-27). Detecting iterative cycles of engineering design from student digital footprints in computer-aided design software. The 11th International Conference of the Learning Sciences, Boulder, CO.