
Building the CODAP Community
Over the past several decades our society has come to rely on data for nearly every aspect of its functioning. Not only is the amount of data generated each day beyond comprehension, no significant problem facing us—from traffic gridlock to climate change—can be solved without the help of people who understand how to work with data. However, “data scientists” are in short supply. Our goal is to create a community of curriculum and software developers committed to ensuring that students from middle school through college have the knowledge and skills to learn with data across disciplines.
Our Common Online Data Analysis Platform (CODAP) offers easy-to-use web-based software that makes it possible for students in grades 6 through college to visualize, analyze, and ultimately learn from data. Whether the source of data is a game, a map, an experiment, or a simulation, CODAP provides an immersive, exploratory experience with dynamically linked data representations, including graphs, maps, and tables. CODAP is not dependent on specific content, so data analysis can be integrated into math, science, history, or economics classrooms.
Open invitation to curriculum developers
Are you developing curricula that engage students with data or doing research into how students understand data and/or data visualizations? Would you like to have an online tool for working with data sets you’ve collected, making it easier to engage colleagues and the public? We’d love to work with you.
CODAP offers many flexible integration options for your curricula. “Data interactives” (games, simulations, database front ends, probe interfaces, and data entry forms) may be embedded in CODAP to serve as a source of data or data can be imported by simply dragging and dropping CSV or tab-delimited text files. You can use CODAP as a standalone environment or include links to CODAP documents within online curriculum materials. For example, a complete CODAP document or individual CODAP graphs, maps, or tables can be embedded in Web pages as an iFrame. Finally, CODAP can be used “behind the scenes” such that the data interactive takes over virtually the entire screen while communicating with CODAP to generate graphs through a custom interface designed into the data interactive.
Thanks to the growing CODAP community, we’ve been adding new features to CODAP. We are currently collaborating with a number of exciting partners and projects.


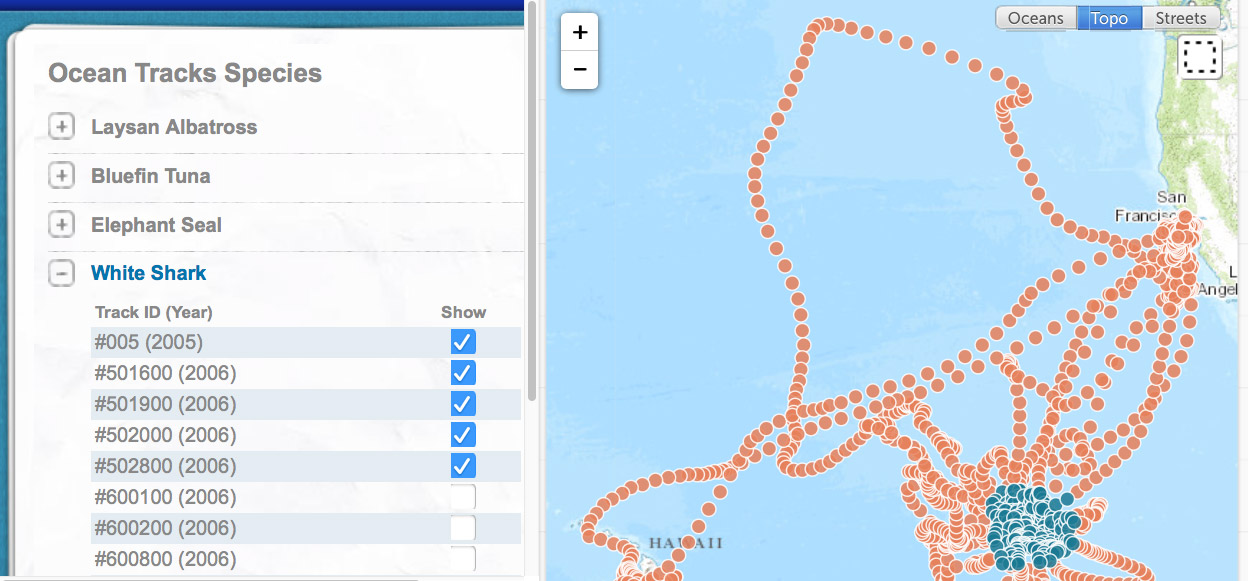
Ocean Tracks. This EDC project offers online software and a curriculum that immerses high school students in an interdisciplinary study of marine biology using GPS data from large sea animals (Figure 1). Based on EDC’s needs, CODAP has incorporated map and measurement capabilities.
InquirySpace. This Concord Consortium project develops digital software and curricula that lead to scaffolded science inquiry. InquirySpace interactives and sensor collectors are embedded in CODAP, so students can analyze data from experiments and simulations. This collaboration led to extensive support for integration of CODAP with an online activity authoring system, extending the ability for teachers to collect collated reports of student work both on CODAP and via embedded assessments in the activity authoring system.
Building Models. The Concord Consortium is developing a systems dynamics modeling tool designed to make it possible for students as young as middle school age to create and experiment with their own computational models (Figure 2). Students validate and refine their models within CODAP by comparing outputs from their own models with data from one or more other sources, including experimental data from probes and data generated by simulations. To accommodate these needs CODAP is developing the ability to analyze two or more data sources and plotting data from multiple sources on a single graph.
Terra Populus. This project at the Minnesota Population Center facilitates research that depends on integration of demographic and environmental data. These data include information about individuals drawn from censuses, area data that summarize demographic and environmental measures at the state level, and raster data (measurements taken over a wide geographic area using satellite imagery and/ or sensors, or a network of local measuring stations or sensors) (Figure 3). The collaboration with CODAP will lead to a website aimed at introducing students to this vast source of rich data, and make it possible to download data as a CODAP document with embedded data sets.
Open invitation to software developers
If you’re creating software for learning about or engaging with data, we invite you to leverage current work and add capabilities to the open source CODAP codebase. CODAP is HTML5, making use of JavaScript, HTML, and CSS3. Various open source libraries are part of CODAP, including SproutCore, JQuery, Raphaël, Leaflet, and several other smaller libraries. CODAP uses SproutCore as an application framework. You can deploy CODAP as a static website with no server interaction. CODAP can be configured to store documents on a user’s local device, or integrated with an online server for cloud-based document management. It can also log user actions to a server specified in a configuration file.
Consider becoming part of the community:
- Clone CODAP from GitHub (github.com/concord-consortium/codap) and make modifications. Submit pull requests so your improvements become part of the master repository.
- Use CODAP as is from our server, taking advantage of continuing improvements as they occur.
- Work together with our team of programmers on software development to integrate CODAP functionality, or to add functionality needed by your project.
- Join our mailing list (groups.google.com/group/cc-developers).
(Read “Under the Hood: Embedding a Simulation in CODAP” in the spring 2015 issue of @Concord to see how you can get started with the code.)
Open invitation to teachers
Teachers, you’re welcome to use CODAP with data of your own or start with several existing curricula that make use of its data exploration capabilities, including Data Games and InquirySpace materials. They’re free and ready to use in your classroom. Explore more activities at the CODAP portal, and let us know if you have ideas for other features you’d like to see. We’re excited about the growing uses of CODAP and anxious to have more students learn with data.
William Finzer (wfinzer@concord.org) directs the CODAP project.
Dan Damelin (ddamelin@concord.org) is a technology and curriculum developer.
This material is based upon work supported by the National Science Foundation under grant DRL-1435470. Any opinions, findings, and conclusions or recommendations expressed in this material are those of the author(s) and do not necessarily reflect the views of the National Science Foundation.