Visualizing Earth and Explaining Seasons
The first person to walk on the surface of the moon, Neil Armstrong viewed our planet as a floating globe in space. He is one of only a dozen who have had the opportunity to view Earth from its orbiting satellite. Photographs from Apollo 11 (Figure 1) give a glimpse of that experience, but what’s it really like to see the entire globe from another plane of reference? And how does that perspective change what we know about our planet, our place in the universe and the role of science in discovery?

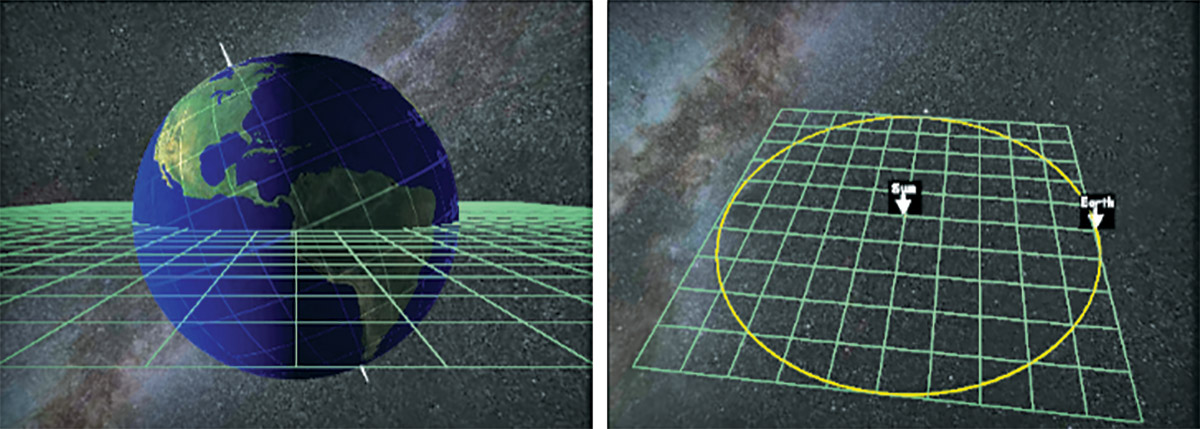
With our Seasons 3D visualization (Figure 2), students can change the Earth’s tilt, rotation, and more—all within a Web browser. A project led by Dr. Marcia Linn and researchers at the University of California, Berkeley, Visualizing to Integrate Science Understanding for All Learners (VISUAL), is creating and researching computer-based visualizations like Seasons to determine how and when they improve science learning. Students use the visualizations to make observations and run simple experiments.
Curriculum design
The VISUAL team created an inquiry curriculum unit on seasons for secondary Earth science students, using the Web-based Inquiry Science Environment (WISE). WISE is a free, online open-source platform developed at the University of California, Berkeley for delivering science inquiry activities. The seasons unit includes multiple visualizations and hands-on inquiry activities supported by instructional scaffolding.
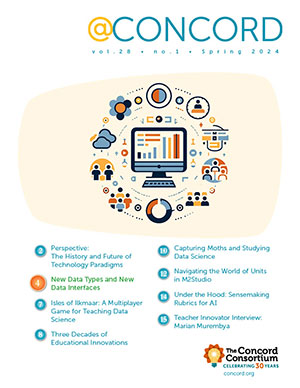
Throughout the unit, students investigate Earth’s seasons through guided inquiry and experimentation. The visualizations were developed both to illustrate key ideas for understanding seasons and to address common student misconceptions about the topic. One of those misconceptions is that seasonal temperature variations are caused by the Earth’s distance from the sun as it travels a highly elliptical orbital path.
The Seasons visualizations, developed at the Concord Consortium, include a number of helpful features to guide students’ inquiry:
- Manipulable and linked representations of different perspectives of the Sun-Earth system. Students can switch between preset top and side views for each perspective (Earth from Spaceship and the Sun-Earth System).
- Features that encourage experimentation. Students can adjust variables (such as month and city) to run different experimental trials. Both perspective windows update to reflect the students’ choices (e.g., a latitude marker appears on the Earth, indicating the location of the selected city).
- User controls for data collection and analysis. Students can keep track of their experimental trials with various user controls and record-keeping tools such as a data collection table and a user-controlled temperature graph.
The unit also uses the Idea Manager, a scaffolding tool designed by the VISUAL team to assist students in collecting and managing their ideas for explaining seasons. Using the Idea Manager, students can add ideas during their inquiry investigations, as well as annotate, flag, revise, delete or restore ideas. The Idea Manager also helps students to use evidence collected from their investigations to evaluate their ideas in preparation for writing about seasons.

The Idea Manager and other instructional scaffolds support knowledge integration (KI), or students’ ability to make connections among important science concepts by: 1) eliciting prior ideas (e.g., responding to a prediction prompt before each visualization), 2) introducing new ideas (e.g., exploring the visualizations), 3) highlighting distinctions (e.g., comparing experimental trials, as well as collecting and annotating ideas using the Idea Manager), and 4) promoting reflection and refinement of ideas (e.g., evaluating and reflecting upon collected ideas to write an explanation using the Idea Manager).
Results
The seasons unit was tested in high school Earth science classes over a period of 10 hours of instruction.* Researchers scored students’ pre- and post-unit test responses using KI rubrics and found that students significantly improved their understanding of and explanations for seasons. And when they analyzed student use of the Idea Manager tools, they found that the visualizations appeared to provide key normative ideas for students’ learning about seasons.
Specifically, they found that students added more ideas to the Idea Manager when explicitly prompted to do so, demonstrating that it is critical to provide instructional scaffolding and learning tools that encourage students to track and monitor their developing ideas. In addition, students flagged the ideas they obtained from using the visualizations as important more often than they did ideas from other sources, indicating the potentially valuable role that visualizations can play in contributing to student learning.
Next steps
The VISUAL team is working on a suite of visualizations for complex scientific phenomena, including chemical bonding, detergents and the energy incident on a solar panel. Our next steps are to connect visualizations with graphs and data tables and to monitor student interactions with them, so we can provide feedback for teachers and researchers (for instance, determining and reporting whether students explore systematically or randomly). We also want to investigate the use of collaborative Idea Manager tools for socially constructing meaning of scientific phenomena.
With each 3D visualization, our research involves exploring the educational effectiveness of different kinds of visualizations as well as student interactions with these visualizations—because, as we know, perspective matters.
* King Chen, J. Y. (2012). Investigating seasons: Designing for inquiry and learning with dynamic visualizations. Poster session presented at the International Conference of the Learning Sciences Doctoral Consortium, Sydney, NSW, Australia.
Jennifer King Chen (jykchen@berkeley.edu) is a doctoral student in the Education in Math, Science and Technology (EMST) program at the University of California, Berkeley’s Graduate School of Education.
Stephen Bannasch (sbannasch@concord.org) is director of technology at the Concord Consortium.
Cynthia McIntyre (cmcintyre@concord.org) is director of communications at the Concord Consortium.
This material is based upon work supported by the National Science Foundation under grant DRL-0918743. Any opinions, findings, and conclusions or recommendations expressed in this material are those of the author(s) and do not necessarily reflect the views of the National Science Foundation.