Wednesday’s Lesson: Visualizing Energy
The concept of energy runs through all topics in science. From the struggles of the tiniest insect to the explosion of the most distant supernova, energy connects the most disparate of scientific ideas together with a tidy coherence. Though the basic notion of energy is simple, it hides a deceptive amount of complexity and nuance. What is energy? What does it mean that energy is neither created nor destroyed? Why is this important?
Teaching students even the most straightforward ideas about energy can be fraught with misconceptions. Conceptualizing an abstract entity that often cannot be seen or felt presents a host of complications, and requires new approaches to teaching. One of the best ways to help students understand such a multi-faceted concept is by using a variety of tools, representations, and strategies. In our Cumulative Learning using Embedded Assessment Results (CLEAR) project with the University of California, Berkeley, we are exploring how different representations reveal student thinking about energy.
In this lesson for middle school students, we introduce four activities that apply to the same physical situation. Students begin with a simple hands-on experiment. Then they represent the concepts visually using an online diagramming tool and in narrative through a story. They conclude by describing an analogous real-world situation.
To elicit student ideas and generate interest in sustainable energy, ask students: Where does the energy from your food go? How can you capture this energy for reuse? Next, introduce students to an innovative way to capture “extra” energy: a cafe in the Netherlands collects kinetic energy from its customers*. The action of people walking through the cafe’s revolving door generates 4,600kWh of electrical energy per year, enough to power an average house.
Now, have your students complete the activities below.
Activity One: The Experiment
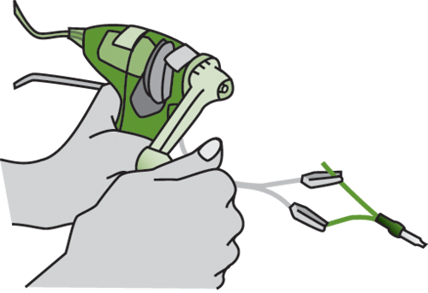
Using a hand-crank generator to illuminate a small light bulb, students can observe a series of energy transformations. To focus on the underlying ideas of energy conservation, prompt students to account for the energy flowing through the system by constantly referring to the following energy questions:
- Where does the energy come from?
- Where does the energy go?
- What forms is the energy in?
- Does the energy change from one form to another?
a) Ask students to light a bulb and describe what’s going on (Figure 1). In addition to the above questions, students should consider: How does the energy travel from one place to another? Do you think the same amount of energy came out of the system as was put into it?
b) Instruct students to disconnect the bulb and crank. Notice that cranking is much easier. Why? What’s happening with the energy now?
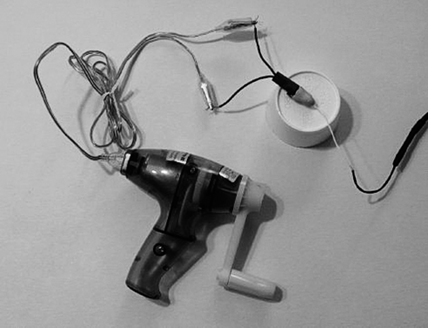
c) Use a temperature sensor to collect evidence about energy. Bury the light bulb and a fast-response temperature sensor in a small amount of clay (Figure 2). Measure the rise in temperature while cranking at different speeds. Why does a bulb produce heat as well as light? Where does the heat energy come from and where does it go? How does the bulb energy get into the clay? Does the rate of temperature rise depend on how fast you crank?
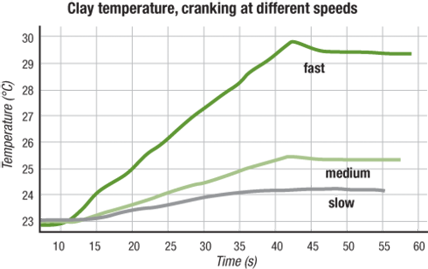
Figure 3 shows a typical set of data for cranking at slow, medium, and fast speeds. (Students can also generate their own data. They should wait between runs for the clay to cool down.) Ask students to interpret the graph. What was the temperature change in the first 30 seconds? What was the rate of temperature increase and how is this shown by the graph? What feature of the graph is related to the heat energy? What happened after the cranking stopped?
Activity 2: The MySystem Diagram
Using the MySystem online diagramming tool, students can drag icons into a diagramming space to represent objects and connect them with arrows to show the direction and amount of energy flowing between them (Figure 4). Have students construct a diagram depicting the energy flow among the hand, generator, bulb, and clay in the first experiment. Students should keep our original four energy questions in mind as they create their work.
Have students change arrow widths to indicate how much energy is transferred at different locations. Also encourage them to use different colors and/or labels to represent the different forms of energy and energy transport involved at each step (i.e., conduction, convection, or radiation of heat energy).
Monitor diagrams for evidence of student thinking. Do the diagrams indicate that the same amount of energy passes through the system unabated? Do students mark energy that is “lost” as thermal energy? (Students can use the globe icon to indicate energy that has been lost as heat.) Where do students think the energy goes once it leaves the bulb? In what forms?
Activity 3: The Energy Story
Ask students to write a narrative describing what happens to the energy in the experiment. Suggest that they write in first person and create a story line.
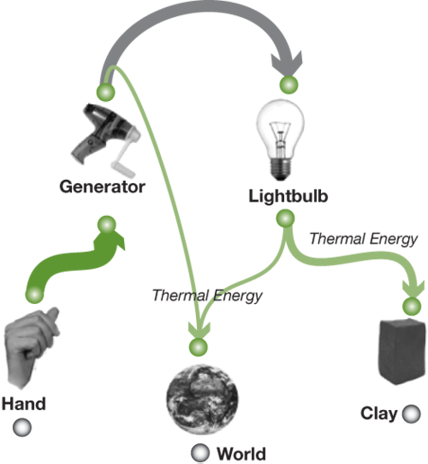
Together, the stories and diagrams serve as a combined representation of students’ thoughts about energy. What conclusions do your students draw?
Activity 4: Real-world Application
Students are now prepared to apply the same analysis to an analogous real-world situation of their own choosing. For instance, they might diagram the energy flow from a hydroelectric power plant to a light bulb in their house, noting energy transformations and heat loss along the way. Or you may challenge them to invent their own version of the revolving door generator, diagramming the inputs, transformations, and outputs. Students can apply the same fundamental questions to these stories, highlighting and discussing where the energy comes from and where it goes. Through this four-step process, students can visualize energy in a whole new way—and perhaps help experts around the world find new ways to use energy more efficiently.
