Under the Hood: Exploring Markov Chains with Animated Graphs in CODAP
Markov chains model systems that move between different states, where the next state depends only on the current state and the preset transitional probabilities, and not on how the system arrived at that state. Our new Markov chain CODAP plugin—created for our AI Education Across the Curriculum project—allows students to generate Markov chain graphs from existing data or by dragging and dropping states and transitions to create their own graphs.
By showing how the states are connected and then animating the transitions between the states in real time, students can more intuitively see how the system moves from one state to another based on predefined probabilities. This visual representation makes abstract concepts such as state transitions and probabilistic outcomes more tangible.
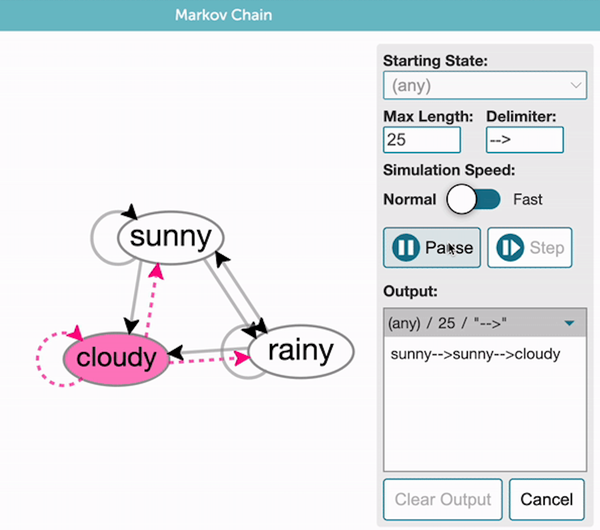
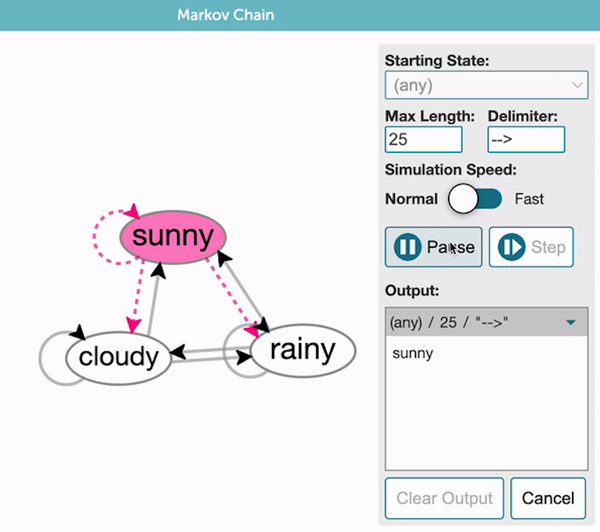
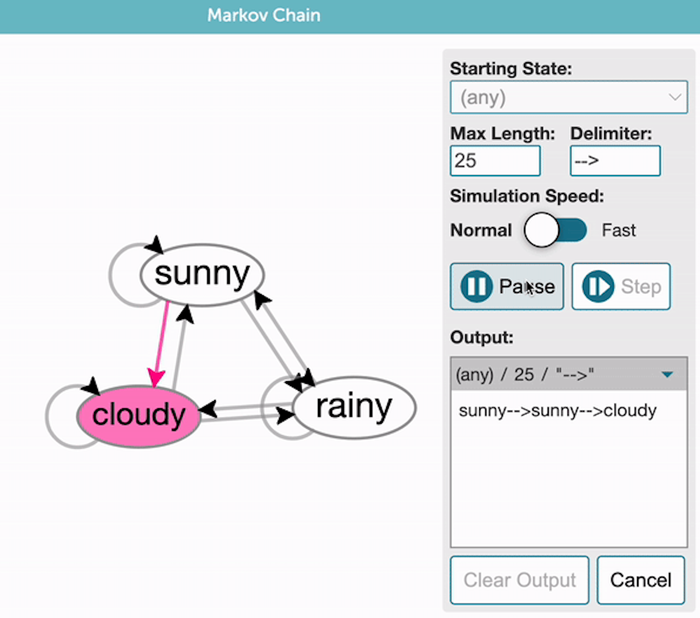
Students can explore the graph by animating the sequence generation, either by playing the whole animation or stepping through it (Figure 1). At the start of the animation, the initial state is highlighted along with the transitions to the possible next states. As the animation progresses, each state transition is highlighted, providing a clear step-by-step illustration of how Markov chains function.
The animation algorithm starts by pre-generating the full sequence of states using the graph and starting state, as well as a maximum sequence length set by the student. Given a starting state, the transitions between states are determined by analyzing the graph and using the transition probabilities to determine the next state. The animation ends when either the sequence length has been reached or a state with no transitions outside of itself is reached. Figure 1. Three states in the Markov chain animation. The dotted arrows represent the possible next state.
Once a sequence is generated, the algorithm then simply steps through that list of animation actions, re-rendering the graph at each step with the different parts of the graph highlighted depending on the action (Figure 2). By pre-generating the sequence and list of actions, the computational load during real-time visualization is eliminated and the code that manages the automatic or step-through animation is greatly simplified.
    const generateSequence = (graph: GraphData,
    options: GenerateOptions) => {
        const {startingNode, lengthLimit} = options;
        const generatedResult: Node[] = [];

        let currentNode = startingNode ||
    chooseRandomNode();
        while (currentNode && generatedResult.length
< lengthLimit) { generatedResult.push(currentNode); const currentEdge = chooseRandomEdge(currentNode); if (currentEdge?.to) { currentNode = graph.nodes.find((iNode) =>
        iNode.id === currentEdge.to);
            } else {
                currentNode = undefined;
            }
        }
        return generatedResult;
    };
Along with highlighting the states and transitions during the animation, each state’s label (e.g., sunny, cloudy, rainy) is output in a list within the plugin with an optional delimiter between labels, allowing students to connect the current animation state to the sequence output. At the end of the animation, the full sequence of states is displayed in a CODAP table, where students can analyze the data in detail, looking for patterns and performing statistical analyses on the state transitions.
Combining dynamic visualization with the data analysis capabilities of CODAP creates a highly effective tool for exploring Markov chains.
Doug Martin (dmartin@concord.org) is a principal software engineer
This material is based upon work supported by the National Science Foundation under Grant No. DRL-2241669. Any opinions, findings, and conclusions or recommendations expressed in this material are those of the author(s) and do not necessarily reflect the views of the National Science Foundation.


