
Math Modeling with M2Studio
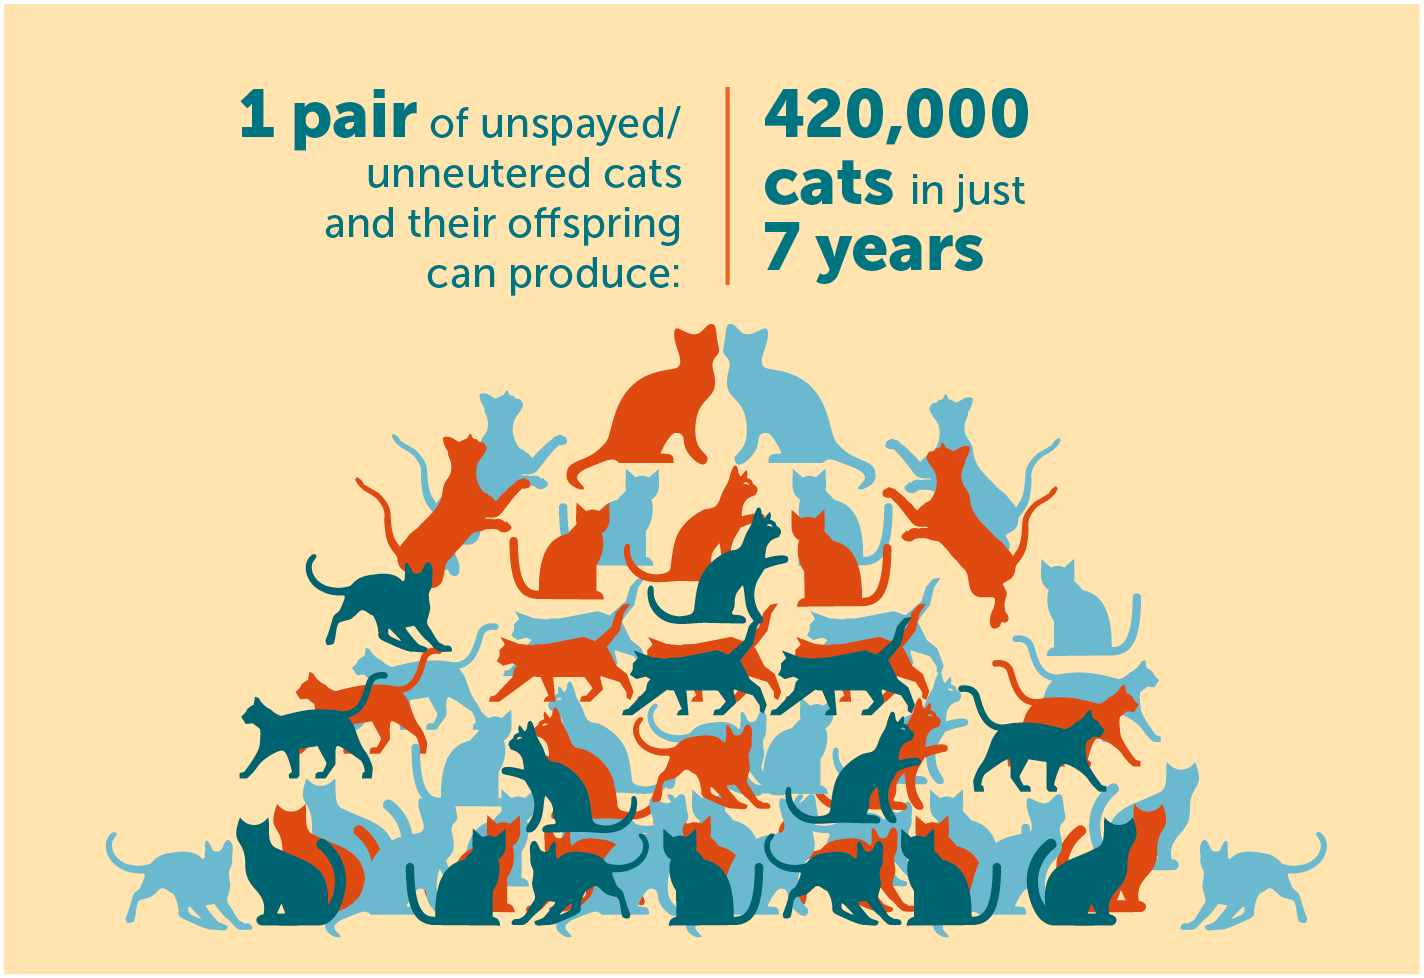
If nothing else can cheer Lila up, cats always do. One day, while scrolling through cat photos online, the ninth grader stumbles onto a poster with a shocking message: “One pair of unspayed/unneutered cats and their offspring can produce 420,000 cats in just seven years.” Lila’s mind is racing with questions: Is that possible? How did they come up with that number? Did they assume unlimited food for all the cats to survive? She grabs a piece of paper and jots down some ideas: number of kittens in a litter, number of litters in a year, when cats are mature enough to have kittens… Before long, the paper is filled with notes on cat reproduction facts, drawings of cat family trees, and lots of calculations.
Lila is a budding mathematical modeler. She uses mathematics to represent and analyze a real-world phenomenon and make predictions about it. Problems like this are distinct from typical word problems. Mathematical modeling problems are often open-ended and ill-structured. Their goals can be vague and the information they provide may be incomplete. A single problem may have multiple solutions that can be evaluated by various criteria under different circumstances. Mathematical modeling is thus challenging to learn and teach.
Our M2Studio project is creating tools, materials, and opportunities for young people like Lila to develop mathematical modeling competencies that are necessary for solving real-world problems using mathematics. In this article, we introduce M2Studio, a web-based learning environment featuring a semi-structured workspace and dynamically linked representations.
Identifying and defining variables and relationships
M2Studio includes a suite of tools, including a rich text editor, a drawing tool, and a diagrammatic programming tool. Using these tools, students can create multiple “tiles” to express their ideas and arrange these tiles based on their flow of ideas or presentation needs.
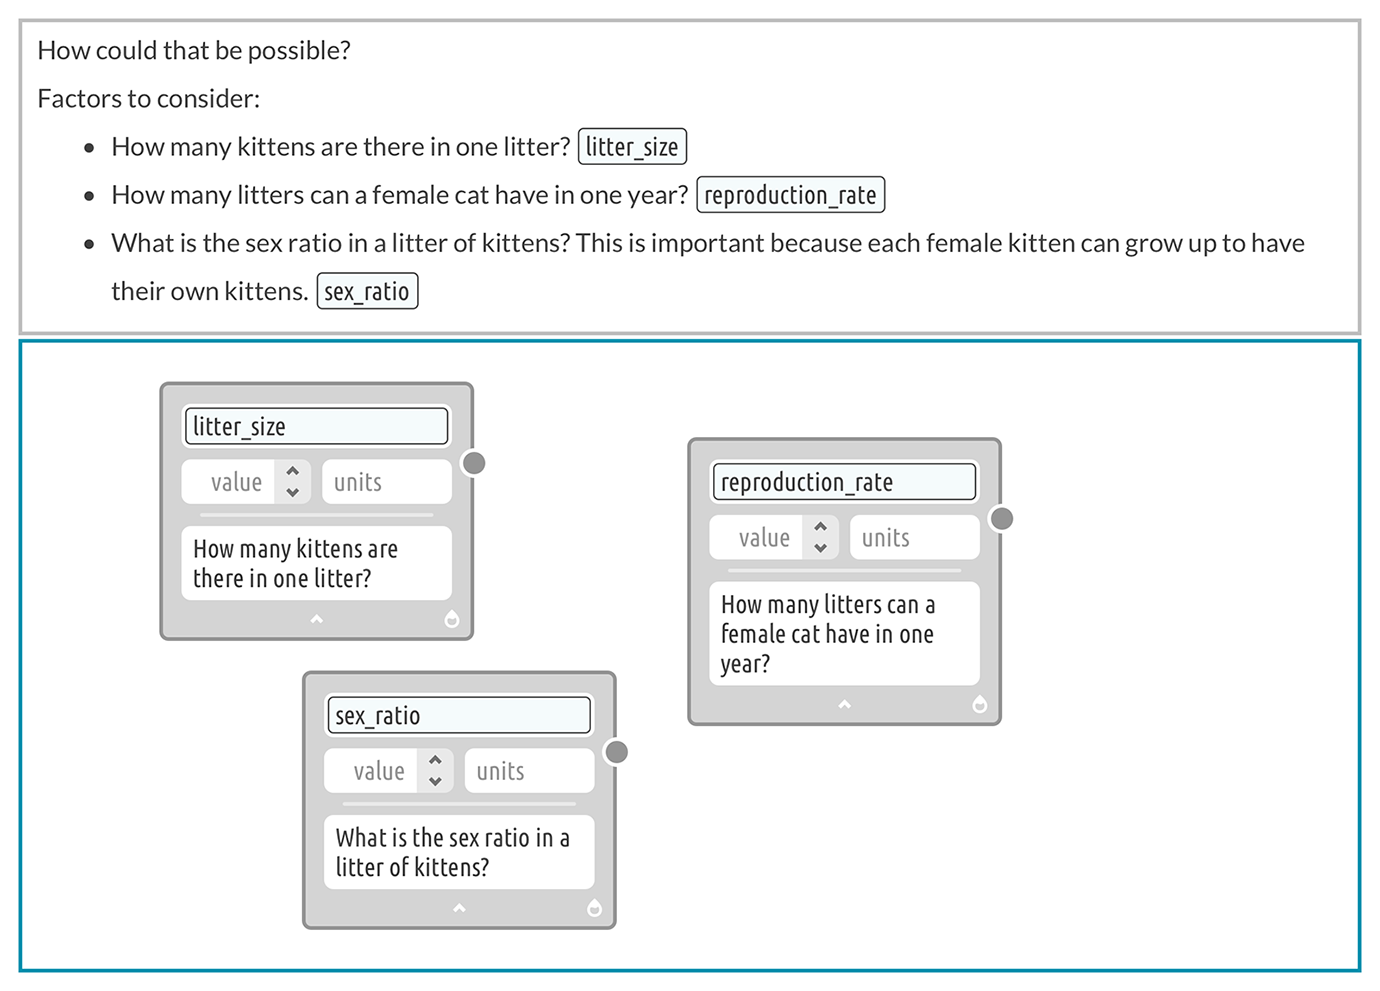
Like Lila, when we see the cat poster, a lot of ideas and questions come to mind. We can use the text editor to record them. How many kittens are there in one litter? How many litters can a female cat have in one year? What is the sex ratio in a litter of kittens?
All of these are useful questions that include within them factors that have numerical values. By selecting the text and opening the variable editor, we can create variables inside the text editor. The newly created variables appear in the text editor as “chips” and in the diagramming area as “cards” (Figure 1). The chip and card point to the same variable so that if we make a change to one, the other instantly updates.
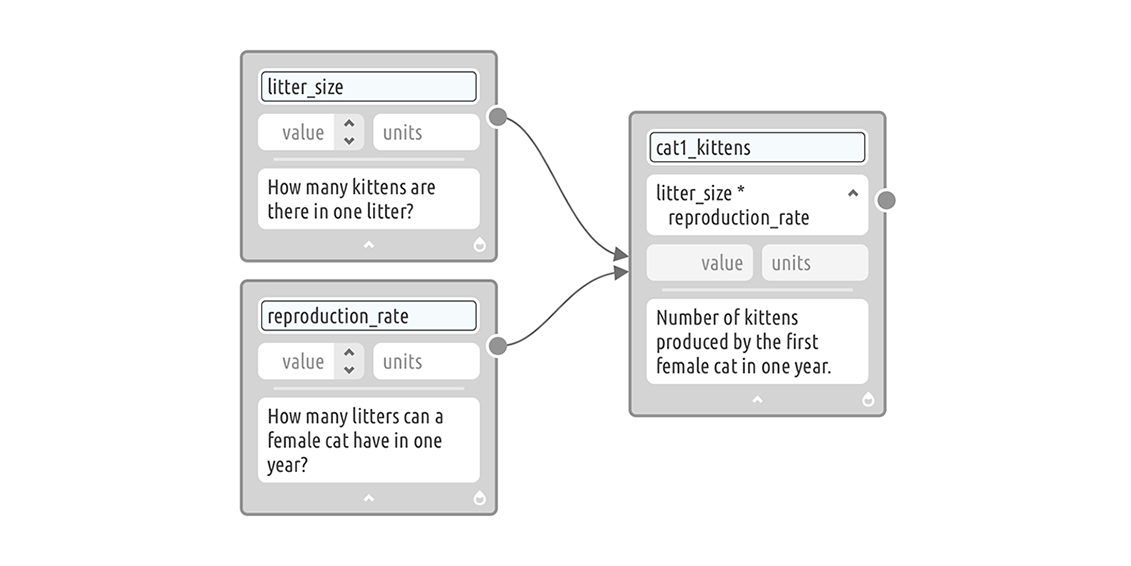
Using [litter_size] and [reproduction_rate], we can determine the number of kittens produced by the first female cat in one year. We can add a variable card for [cat1_kittens], connect the two cards to it, and write an expression: [litter_size] * [reproduction_rate] (Figure 2).
With a quick Internet search, we find that cat litter size ranges from 1 to 5 with an average of 3.7 for street cats, and that the reproduction rate ranges from 1 to 3 litters per year with an average of 2 to 2.5. To simplify, we assume the litter size is 4 kittens/litter and the reproduction rate is 2 litters/year. Once we set these values and units in the cards, the value and unit for [cat1_kittens] is calculated. We can then report it in the text editor by inserting the [cat1_ kittens] variable, where we see the value 8, the result of 4 * 2.
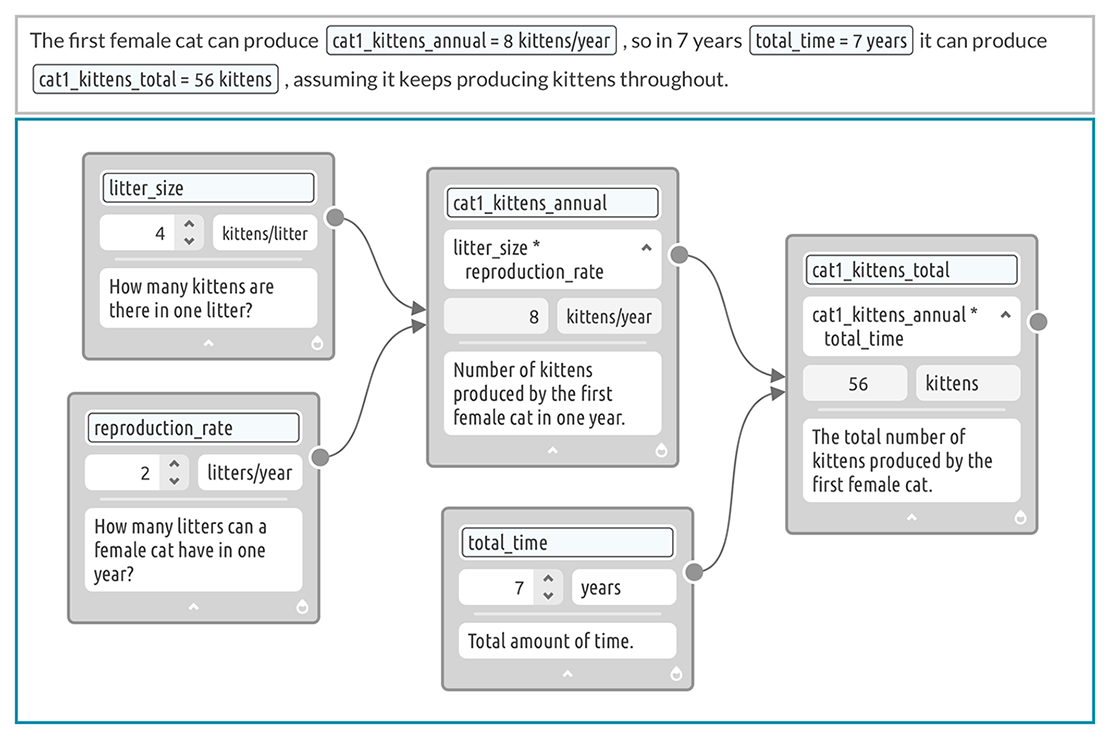
Realizing that the total amount of time can also be a variable, we turn “7 years” into the variable [total_time] and create another variable [cat1_kittens_total]. Finally, we change [cat1_kittens] to [cat1_kittens_annual] for clarity (Figure 3).
So far, we have only looked at the offspring of the first female cat. What about the female kittens in each litter? They will also have their own offspring. Next, we consider how long it takes for female kittens to have their own kittens. According to our source, cats start having kittens from 4 to 18 months old. Since we want to see if it’s possible to reach the number in the poster, let’s assume the shortest time.
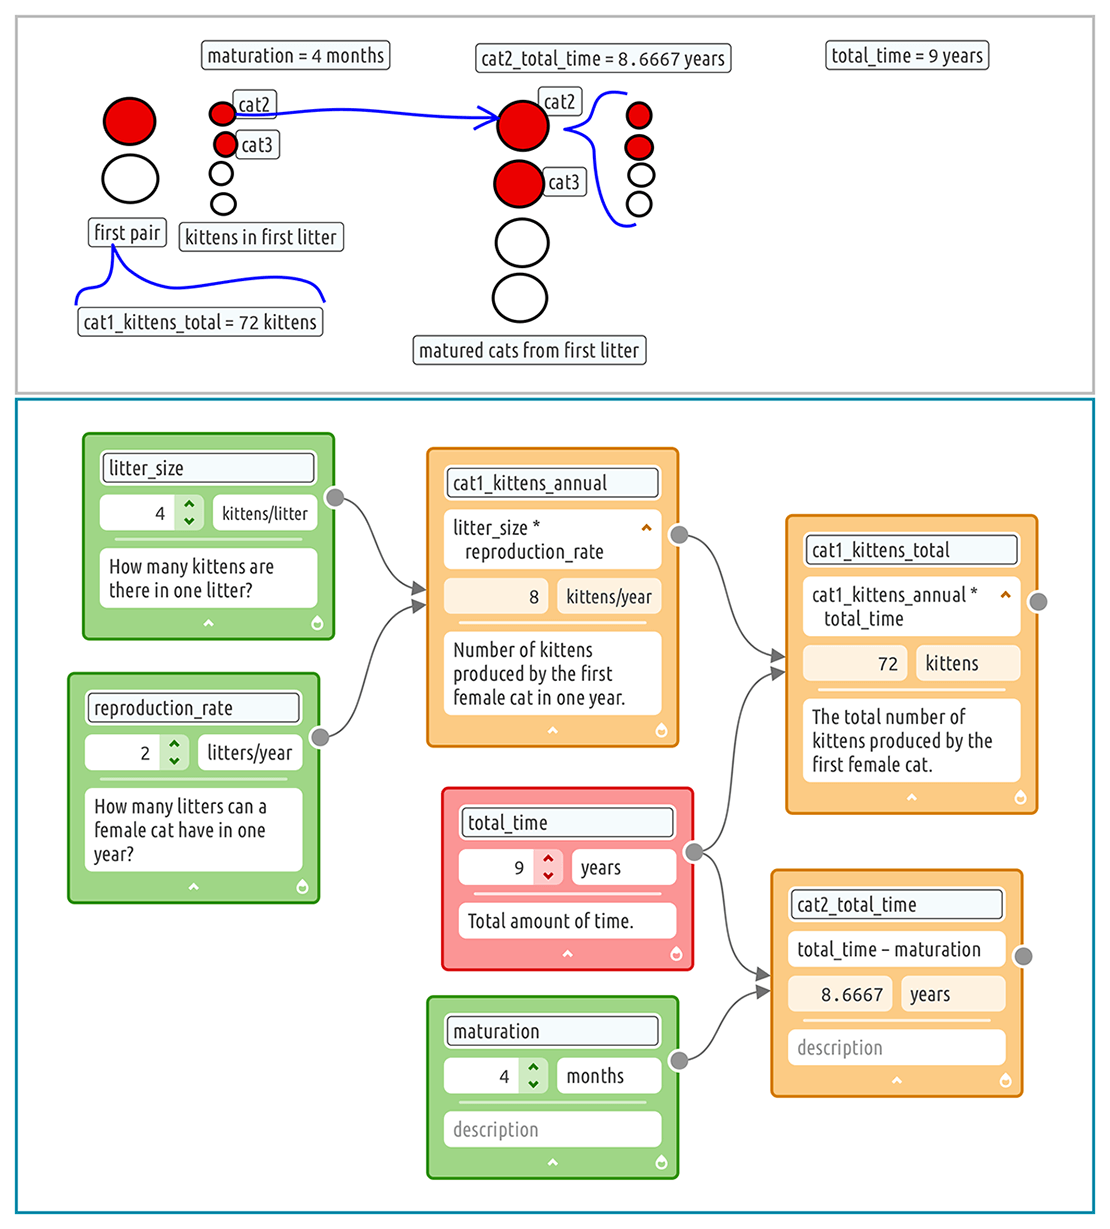
We use a drawing to visualize cat family trees where big circles are mature cats and small circles are newborn kittens and where red are female and white are male (Figure 4). Assuming the sex ratio is 1:1, there will be two female kittens (cat2 and cat3) in the first litter from the first pair of cats. The kittens will take 4 months to mature and start having their own kittens. So, the total amount of time for them will be 4 months shorter than 7 years. We can label our drawing with these variables to make the relationships clear. Because we are using variables, we can test different scenarios. What about 9 years? If we change [total_time] to 9 years in the diagram, the amount of time for cat2 changes accordingly and the total number of kittens produced by the first female cat [cat1_kittens_total] also increases to 72.
Although we haven’t yet determined if it’s possible for one pair of unspayed/unneutered cats and their offspring to produce 420,000 cats in seven years, we are on our way. Note that our partial solution is based on many assumptions we made earlier. There are more variables and assumptions we could incorporate into our cat reproduction model.
Supporting mathematical modeling competencies
M2Studio is designed to support students in developing mathematical modeling competencies, allowing them to express their ideas in multiple representations and highlighting the connections among representations. By presenting variables and relationships as easy-to-manipulate digital objects and placing them at center stage, M2Studio embodies the key practices of building, testing, and iteratively refining models.
If you are interested in piloting our M2Studio math modeling lessons in your high school classroom, please contact us at m2studio@concord.org.
* Little, S. E. (2011). Female reproduction. The Cat: Clinical Medicine and Management, 1192–1227. https://doi.org/10.1016/B978-1-4377-0660-4.00040-5
This material is based upon work supported by the National Science Foundation under grant DRL-2101382. Any opinions, findings, and conclusions or recommendations expressed in this material are those of the author(s) and do not necessarily reflect the views of the National Science Foundation.