
Share and Share Alike: New tools for tracking and supporting knowledge co-construction in mathematics classrooms
Mathematics assignments are primarily designed to demonstrate the individual performance of learners, who are often discouraged from working with one another. “Borrowing” ideas from another student’s work becomes “cheating.” For over 30 years, the Connected Mathematics Project (CMP) has been working to turn that idea on its head.
According to CMP, mathematical knowledge is best discovered through co-constructing mathematical concepts with one’s peers. In CMP classrooms, learners work together in small groups to solve problems and derive mathematical principles that can be shared with the class. The dividends from this kind of teamwork are manifold—from gaining meaningful collaboration experiences to mastering deeper mathematical knowledge. But it can be difficult for teachers and students to unlearn years of conditioning that says “sharing is cheating.”
The Concord Consortium and Michigan State University have been developing the Collaborative Learning User Environment (CLUE) to support the sharing of mathematical artifacts. By logging all student actions, CLUE also provides detailed information about learner sharing behaviors. We are researching indicators of knowledge co-construction in CLUE, and hope that by exposing teachers and learners to these indicators we can shift social norms, changing the “social infrastructure” of the classroom to embrace sharing and co-construction activities.1
Defining co-construction as artifact sharing
CLUE emulates the small group work in CMP classrooms by providing all learners with individual workspaces, where they can create mathematical artifacts, plus import them from the curriculum, groupmates’ workspaces, or documents published by the teacher or other classmates (Figure 1). While CLUE does not support direct artifact co-construction (as when multiple learners edit a shared Google document), it permits indirect co-construction through artifact sharing. For example, a teacher can share a table of data with the class or urge an individual student to publish a creative exploration of a mathematical problem. Learners are strongly encouraged to borrow (i.e., copy) artifacts they find helpful in constructing solutions in a “bricolage” style approach rooted in constructionist and constructivist theories of learning. This cross-pollination allows ideas to spread within groups and across the classroom as concepts get developed.
Defining indicators of artifact sharing
Social Network Analysis (SNA) studies how people connect to one another, for example, via social media. In an ideal co-construction scenario, we would expect to see group members sharing with one another frequently, where the sharing is distributed evenly (i.e., learners are not left out) and is reciprocated (more than one learner is the source of artifacts). We explore these metrics in the CLUE environment, noting that researchers have found other SNA metrics to be more or less reliable for studying collaborative learning.2
Frequency of sharing as a relative comparison
One group of learners shared artifacts 15 times over a 40-minute class—a frequency of 0.375 per minute. Is this a lot or a little? Does the teacher need to intervene to encourage more sharing or not? To acquire meaning, a frequency reading must be defined relative to another frequency reading (e.g., relative to the problem, other groups, or the group’s own sharing behaviors over time), and teachers may want to examine frequency in different ways depending on their goals (e.g., gauging whole class performance on a problem or flagging groups for sharing behaviors).
Table 1 shows data from two 7th grade groups of learners engaged with three different CMP investigations. Based on tallies, it seems that Group B shares artifacts half as much as Group A on Investigation 1. If we look at percentiles, Group B is in the 80th percentile, a rank they maintain for Investigation 2. But by the third investigation, Group B has dropped its sharing by 4. Group A has also dropped, by 3. Is this difference just as meaningful for both groups? Group A is still in the 95th percentile for Investigation 3, while Group B is in the 60th percentile (down from the 80th). A within-group examination shows that for Group A, it is a 20% drop in their average sharing, following a 68% gain between Investigations 1 and 2, a net 40% gain; for Group B it is a 114% drop, following a 57% drop between Investigations 1 and 2, a net 171% loss and noteworthy trend. The different ways frequencies can be examined can suggest different conclusions about when and how to intervene.
| Investigation 1 | Investigation 2 | Investigation 3 | |
| Sharing Event Counts | |||
| Group A | 11 | 21 | 18 |
| Group B | 6 | 4 | 0 |
| Across-Group Percentile of Sharing | |||
| Group A | 90% | 95% | 95% |
| Group B | 80% | 80% | 60% |
| Within-Group Change in Sharing | |||
| Average Sharing |
Δ Investigations 2 & 1 (% change) |
Δ Investigations 3 & 2 (% change) |
|
| Group A | 14.75 | 10 (68%) | -3 (-20%) |
| Group B | 3.5 | -2 (-57%) | -4 (-114%) |
Distributed sharing: Density and isolates
Density is a common SNA metric that measures distribution by dividing the number of observed connections by the number of possible person-to-person connections. Unfortunately, it can mask loners and super-contributors. For example, Group C has a density of 1.0 for Investigation 1, suggesting that the sharings are evenly distributed among group members, but in fact one of the group members was left out. Conversely, Group D has the highest density for that investigation (D=1.5), but 15 of the group’s 18 sharings originate with the same super-contributor student. Density measures need to be augmented with extra information, such as “loner alerts,” and a way to indicate if sharing is unidirectional or reciprocated.
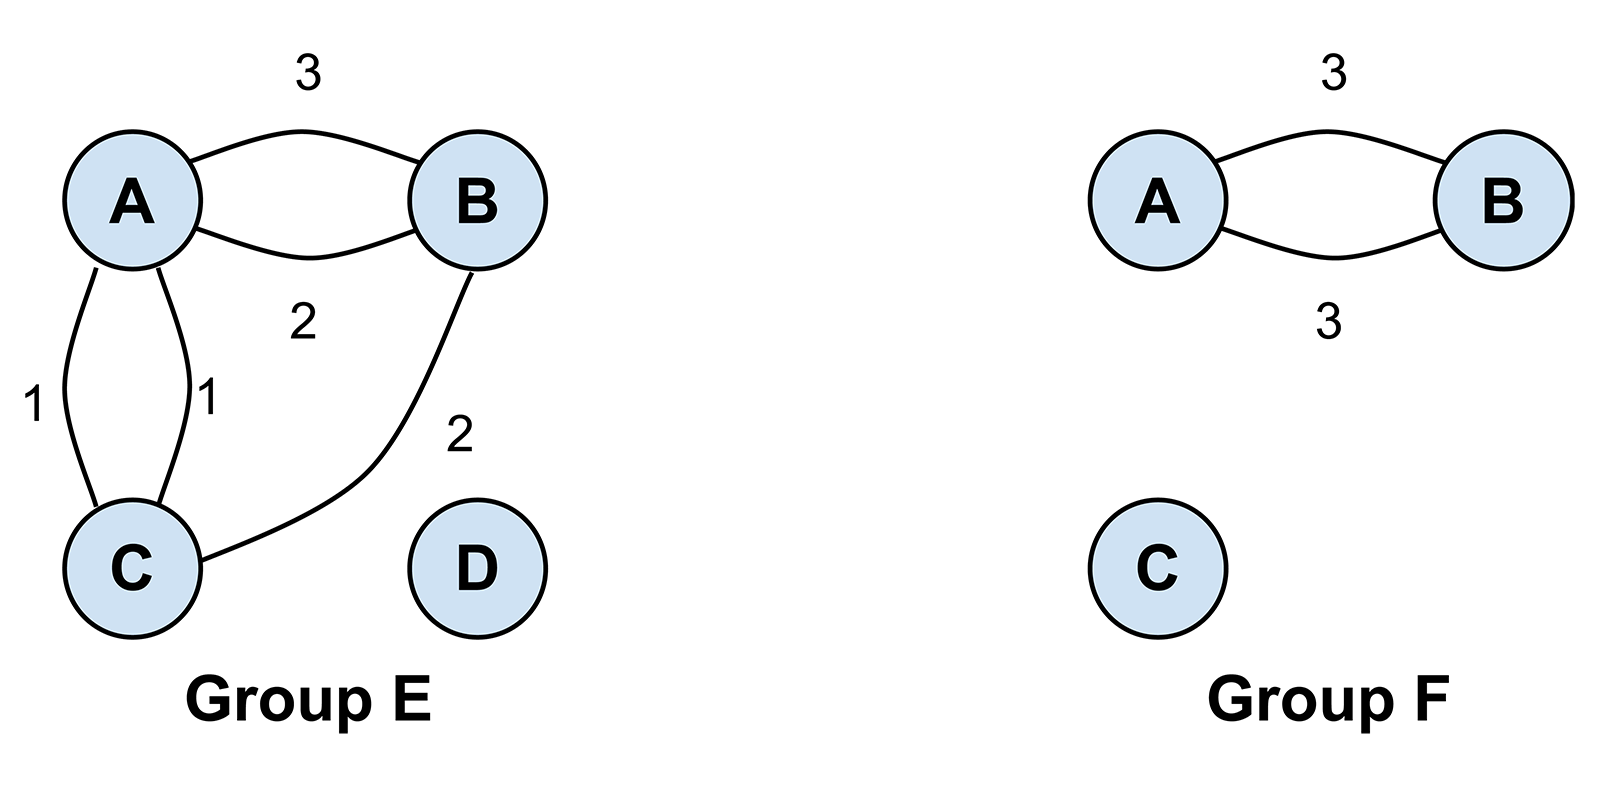
Misleading reciprocity
In SNA, reciprocity quantifies how many of the connections between people are bidirectional. This can detect sharing imbalances (e.g., where only one student’s work is being copied), but it can mislead. Figure 2 shows the sharing behaviors of two groups. There are more reciprocal relationships in Group E (two) versus Group F (one), and the number of reciprocations is the same in both groups (three). But traditional measures of reciprocity, which gauge the distance from purely symmetrical reciprocation, would give Group F a higher reciprocity.*

Instead, we must compute the reciprocity of mutually sharing dyads separately from the non-reciprocity of non-mutual dyads, as combining these phenomena renders any group rankings meaningless. We defined a reciprocity measure, Small Group Mutual Arc Reciprocity (SGMAR), that calculates mutual reciprocity and conditions it on the proportion of mutual dyads within the group, which better characterizes mutual sharing relationships. We also defined an Unreciprocated Arc Ratio (UAR) that measures the proportion of total sharing acts that were not part of a mutual dyad. Group E and Group F have an SGMAR of 0.25 and 0.17, and UAR of 0.22 and 0, respectively. These values allow group rankings in terms of “relationship building” versus “one-way copying.”
Conclusion
Doing mathematics is inherently a social and collaborative activity. Many assumptions underlying SNA make applying it to artifact sharing in small collaborative groups challenging. But by bringing a sensitivity to how teachers (and possibly learners) might use this information, we can adapt SNA metrics to reveal intriguing student sharing phenomena. The next step is to work with teachers to determine how this information might shape their practice and how they would prefer to receive and view the information (e.g., via filters, rankings, or visualizations such as heatmaps). Our ultimate goal is to design interface features that help expose the value of shared learning activities and make clear to teachers and students alike that in a CMP classroom, copying isn’t considered cheating. Borrowing is an important part of knowledge co-construction.
* Using Arc Reciprocity, the value would be 1 versus 0.5; using Garlaschelli and Loffredo’s definition, it would be 1 versus 0.76.
1. Bielaczyc, K. (2006). Designing social infrastructure: Critical issues in creating learning environments with technology. Journal of the Learning Sciences, 15(3), 301–329.
2. Saqr, M., Viberg, O., & Vartiainen, H. (2020). Capturing the participation and social dimensions of computer-supported collaborative learning through social network analysis: Which method and measures matter? International Journal of Computer-Supported Collaborative Learning, 15(2), 227–248.
Leilah Lyons (llyons@nysci.org) is Director of Digital Learning Research at the New York Hall of Science and Adjunct Research Associate Professor at the University of Illinois at Chicago.
Merve N. Kursav (kursavme@msu.edu) is a Ph.D. candidate at Michigan State University.
Alden J. Edson (edsona@msu.edu) is a Research Assistant Professor of Mathematics Education at Michigan State University.
Chad Dorsey (cdorsey@concord.org) is President and CEO of the Concord Consortium.
This material is based upon work supported by the National Science Foundation under grants DRL-1620874 and DRL-1660926. Any opinions, findings, and conclusions or recommendations expressed in this material are those of the author(s) and do not necessarily reflect the views of the National Science Foundation.