
Writing Data Stories
Today’s students will encounter data in one form or another throughout their lives. The more data fluent they are when they graduate, the better prepared they will be to contribute to society as citizens and to advocate for themselves and their communities. Working with data should be an integral part of schooling, and students should expect that data will be part of their learning experience in every subject.
The goal of our new Writing Data Stories project is to infuse the analysis of existing scientific datasets about important socio-scientific issues (such as nutrition or human impacts on Earth systems) into middle school science through “data storytelling.” This National Science Foundation-funded three-year project is a collaboration between the University of California, Berkeley, North Carolina State University, University of Texas at Austin, and the Concord Consortium.
We hope that students will learn to tell stories about patterns they discover in data, and how data help them make decisions in their own lives. We’re currently designing curriculum activities that encourage students to tell data stories about questions that matter most to them. Students record information about where the data come from and explain why the data are important, what is included or excluded, and how they wrangled the data into a useful form.
Breakfast nutrition data
In one activity, we introduce middle school students to nutrition and health science topics through relevant experiences in their daily lives. We start by asking students to collect nutrition labels for cereals and other breakfast foods they have eaten recently. Students also make corresponding labels reflecting nutritional information they find online about home-cooked or other foods.Students then work in small groups to gather their nutrition labels together, creating a physical dataset. They organize the labels—sorting by sugar content or protein to find the healthiest options or grouping the labels into foods that everyone in the group can eat, including those with allergies or other food restrictions. As they start to balance multiple nutritional needs, they develop strategies to organize the nutritional labels along many dimensions—balancing sugar content, fiber, and allergy restrictions. Working with this tangible dataset, they develop a data-informed sense of which foods might be the best breakfast choices.
Common Online Data Analysis Platform
Making “data moves” by grouping and sorting pieces of paper is clumsy, time consuming, and all too frequently frustrating. Students need computational tools to become fluent with the types of large datasets commonly used today. Enter the Common Online Data Analysis Platform (CODAP). Designed as an exploratory, immersive environment for students in grades 5-14 to work with data, CODAP can easily handle even thousands of items and allow students to interact with these data intuitively.
We found a dataset with nutritional information for 77 of the most popular breakfast cereals and presented this data to students using CODAP.* While the dataset provides useful information about what some students may eat for breakfast, it also leaves many other breakfast foods and considerations out. Not everyone eats cereal for breakfast, and not everyone makes breakfast decisions based on nutritional information alone.
Students identify what is missing from the cereals dataset that would help them to make a healthy breakfast decision. They enter data for non-cereal breakfast foods or for cereals that are not currently in the dataset. They can also add new attributes that are important in their decision-making, such as taste and cost.
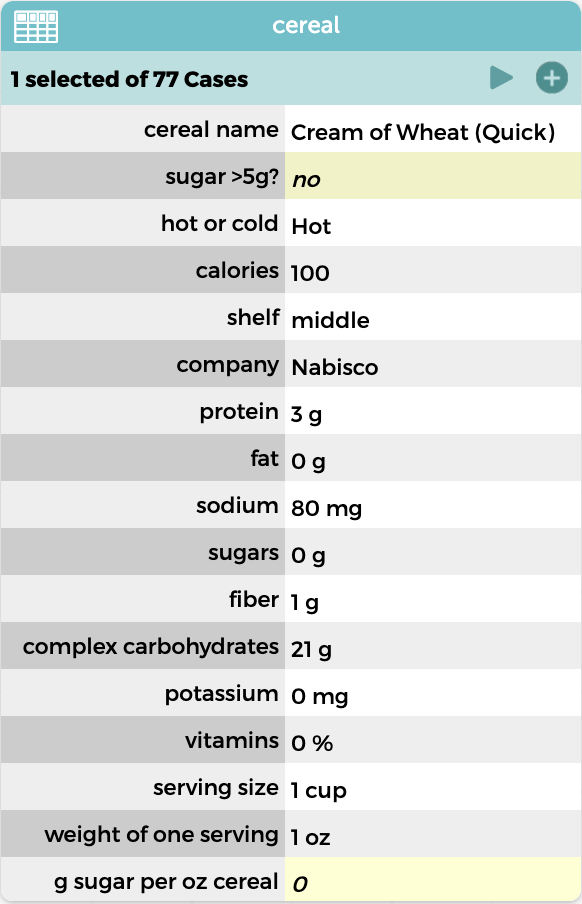
Because there are a lot of attributes, students use a case card rather than a case table for data entry (Figure 1). These cards look a lot like the paper nutrition labels, allowing an easy transition to thinking about existing measures such as sugar and fiber, and helping students think about new attributes, such as the shelf where a specific cereal is located in the grocery store.
Then it’s time for students to ask questions and make conjectures. What do you want to find out? What do you expect to see and how can you see if you’re right? Which cereals have the most sugar, fat, or protein? Are the foods that you eat at home healthier than the cereals advertised on television commercials? How do you measure health? Are there relationships between attributes? For example, do cereals with more sugar also have more calories per serving? Can you discover anything about which cereals get placed on which grocery store shelf? If you added attributes that are important to you, such as cost or allergenic ingredients, how do they impact how many healthy options are available?
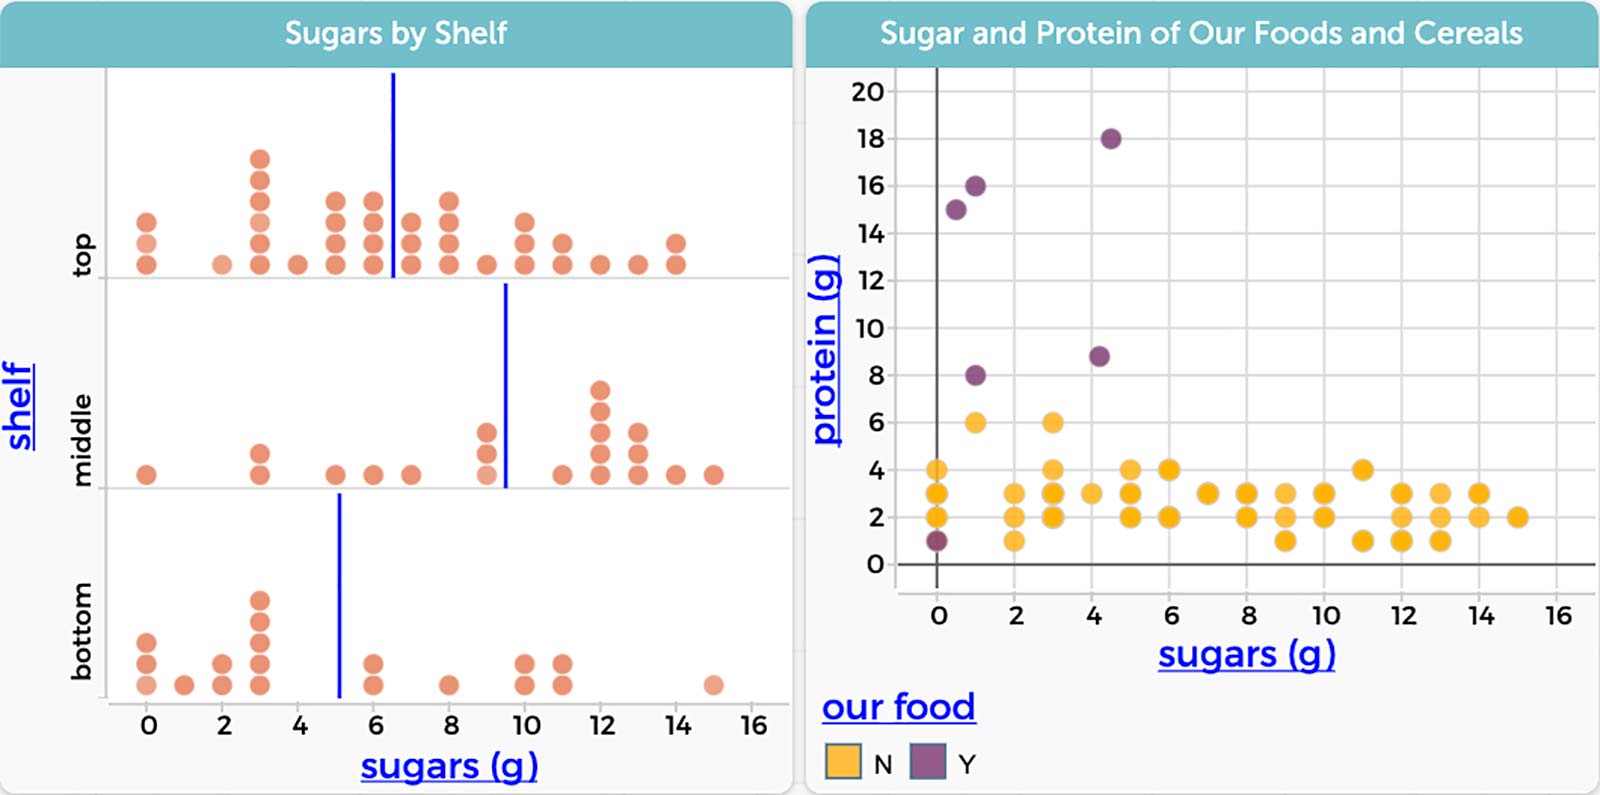
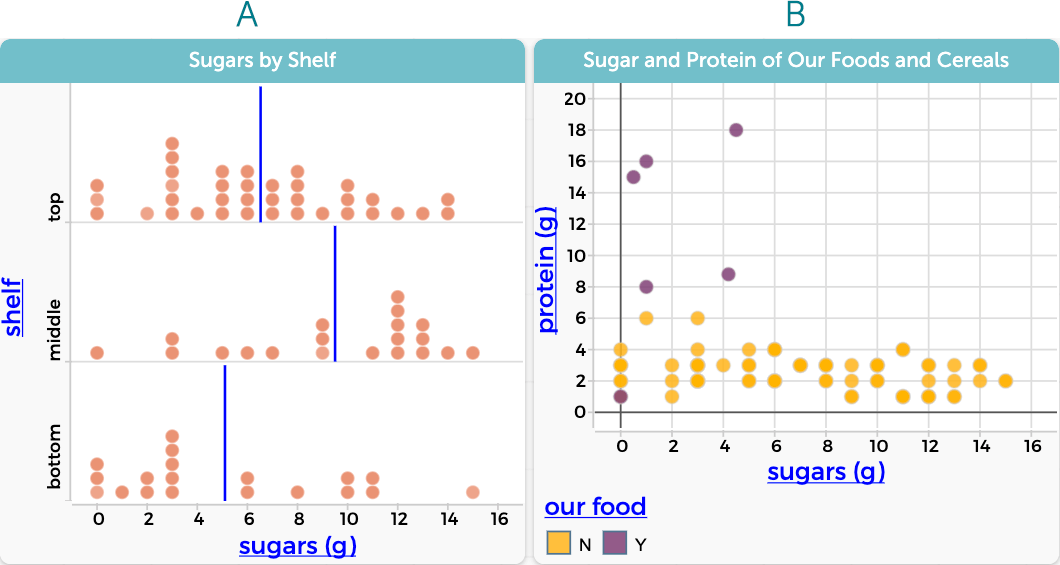
Small groups of students choose a question to investigate. They keep track of their data moves—adding new foods or attributes like taste or cost, grouping the dataset in particular ways, or building new measures such as a sugar-fiber ratio—and why they are important for their decision-making. As they work with the data to make it useful for their inquiry, they will make new discoveries. One group may find that cereals positioned on the center shelf, which corresponds to the height of many children, seem to have more sugar on average than cereals on the bottom or top shelves (Figure 2A). Another group might find that many of the traditional and regional breakfast foods their families eat (like longganisa sausages, egg wraps, or manaeesh) are lower in sugar and higher in protein and fat than most cereals, which helps them feel full and more ready for school in the morning (Figure 2B).
Story Builder
Many technologies can assist students in writing a data story—word processors, slideshow tools, screencast video makers, and screen capture software for taking simple screenshots. We are also building an easy-to-use tool within CODAP, called the Story Builder, in which students can create and assemble a sequence of story pages for a presentation. During their presentations students are able to interact with CODAP’s graphs and tables to demonstrate what happens when you select different cases, plot different attributes, or make additional graphs.
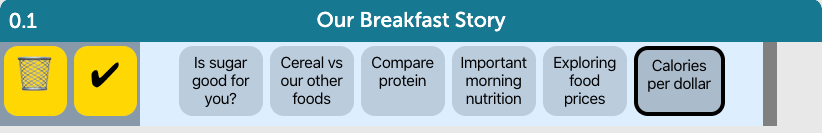
In our current Story Builder prototype, pages appear as labeled buttons (Figure 3). Students write labels to describe the content of each page. When students click on a page, CODAP reconfigures the data to appear just as it was when they originally “captured” the page via a special “shutter snapshot” button. Students can reorder or delete pages as they work on their data story. Story Builder pages are saved with the original CODAP document.
Students add pictures and video to their stories by simply dragging them into the document. They can include narrative text to help them remember the storyline when they present to the class, and add captions to help their audience understand.
We hope that as students create these data stories, they experience data as relevant and they feel ownership of the data and their data discoveries. Young people are natural storytellers, and they should feel confident with data as a new medium for telling their stories.
*The cereals dataset was gathered and cleaned by Petra Isenberg, Pierre Dragicevic, and Yvonne Jansen. The original source is available at: https://perso.telecom-paristech.fr/eagan/class/igr204/datasets
BillFinzer (wfinzer@concord.org) is a senior scientist.
Michelle Wilkerson (mwilkers@berkeley.edu) is an Assistant Professor at the University of California, Berkeley.
Science Foundation under grant DRL-1900606. Any opinions, findings, and conclusions or recommendations expressed in this material are those of the author(s) and do not necessarily reflect the views of the National Science Foundation.