Monday’s Lesson: Exploring Data with the Ramp Game
The Next Generation Science Standards promote learning science by doing science. Our new InquirySpace II project guides students in independent investigation by providing curricular and pedagogical scaffolds to support the exploration of phenomena. A game we are continuing to develop focuses on a classic physics experiment—rolling a car down a ramp. Students investigate the difference between dependent and independent variables and learn to work with data in our Common Online Data Analysis Platform (CODAP).
Try the Ramp Game
Open the Ramp Game in CODAP: concord.org/codap/ramp-game
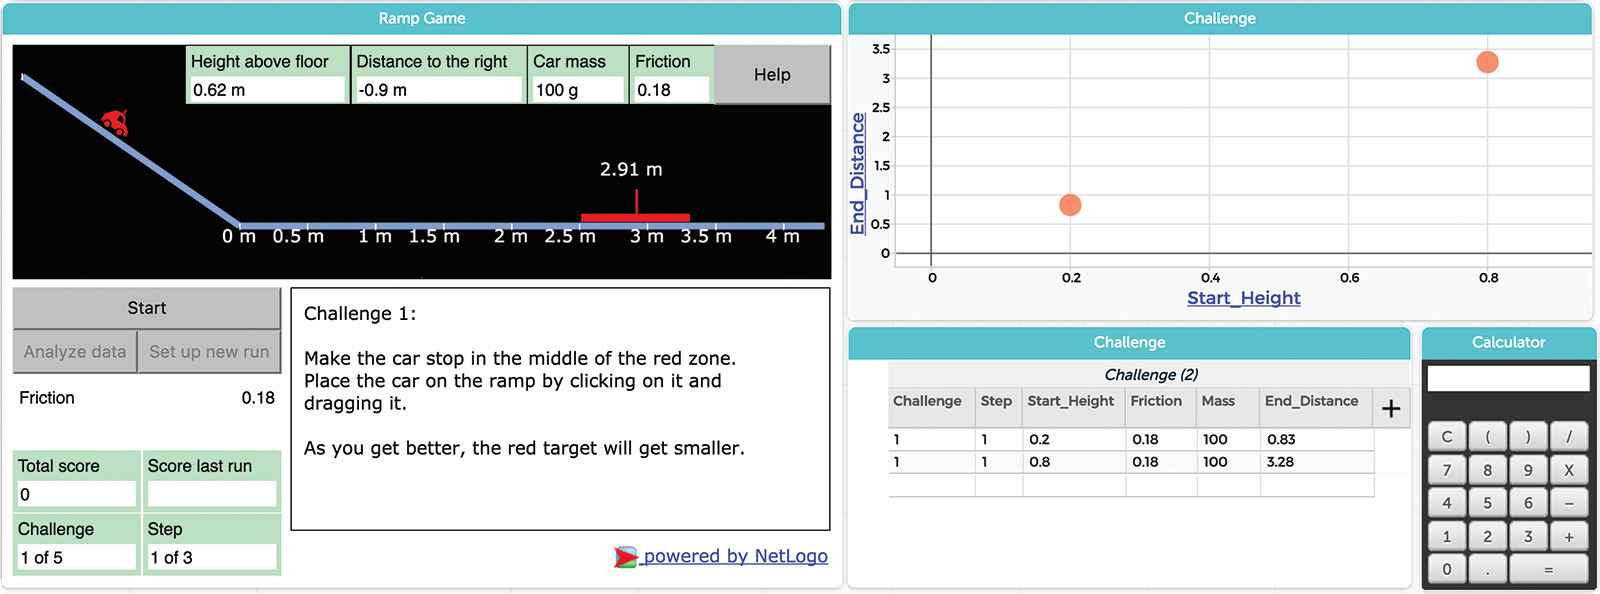
In the Ramp Game (Figure 1), your job is to place a virtual car at the right height so it lands close to the center of a target. There are five challenges with multiple levels for each challenge. To start an experimental run:
- Click “Start” to see how far the car rolls.
- Click “Analyze data” to see the result.
- Click “Set up new run” to try again.
With each run, drag your car up or down the ramp to change the starting height and try to hit the target more accurately. Keep trying until you score enough points to advance to the next level. Note that the target gets smaller at each level!

Be sure to discuss experimental variables with your students after their initial success at landing on the target. The independent variable is the variable being changed (the car’s starting height). The dependent variable is the parameter being affected (distance the car moves). Other variables are held constant (friction, mass of the car, etc.).
Do you notice a pattern in the table or graph? Use CODAP to analyze your data, determine the relationship between the starting height of the car and the distance it travels, and get better at the game. To make predictions from your graph, add a fit line and related linear equation:
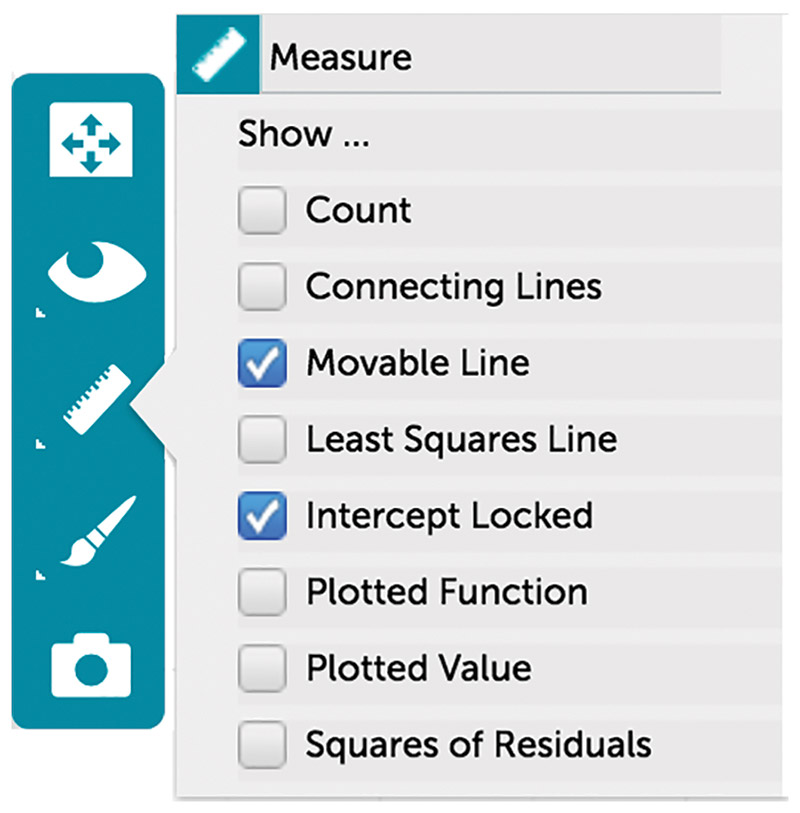
- Click on the graph. A set of tools appears to the right (Figure 2).
- Select the Measure tool, then “Movable Line” and “Intercept Locked.” A line and equation appear on the graph.
- Rotate the line by hovering over the upper right and dragging up or down.

Each new challenge changes a variable affecting the car-ramp phenomenon. The final challenge changes the independent variable from height of the car to friction.
Experiment with friction while holding the car’s height constant. To excel at the game, create a new graph, then add the independent and dependent variables by clicking the label on the x and y axes and selecting variable names. You can also drag a table column header to a graph axis. To hide data from previous challenges, select data rows in the table, then click in the graph’s header. Choose the eye icon and “Hide Selected Cases.”
In our first InquirySpace project we used logs of student data and a sophisticated model analysis algorithm to group students into broad categories of problem solvers (see “Analytics and Student Learning: An Example from InquirySpace” in the Spring 2015 @Concord). Did they make reasoned guesses from the animation? Did they use the table, graph, or equation? This research is now helping us develop increasingly sophisticated games to move students toward data and data visualization literacy.
Tom Farmer (tfarmer@concord.org) is a curriculum developer.
This material is based upon work supported by the National Science Foundation under grant IIS-1147621. Any opinions, findings, and conclusions or recommendations expressed in this material are those of the author(s) and do not necessarily reflect the views of the National Science Foundation.
