Free SmartGraphs Activities Help Students Make Sense of Graphs
Graphing calculators are ubiquitous in science, math and engineering courses. But while they have many excellent features—including the fundamental ability to create graphs—these handheld devices don’t really know what graphs mean. And that’s a critical failure; they can’t help students make sense of a graph.
Our SmartGraphs open-source software provides scaffolds and hints to students who need help understanding a graph. These visual and textual hints make our SmartGraphs activities smart.
Activities run directly in a modern Web browser using HTML5 (JavaScript). There is nothing to download or install. Most SmartGraphs activities also run on tablet computers, like the iPad (although portions of any activity using a motion sensor need to run an invisible Java applet, which isn’t feasible on most tablets).
Teachers, curriculum developers or others who want to create a new SmartGraphs activity don’t need to know HTML5 or any programming language. Our form-based authoring system makes it easy to customize existing SmartGraphs activities or create new ones simply by filling in online forms. And because the SmartGraphs software is flexible, activities can be used to teach algebra, physical science, biology, psychology or any other subject where it is important for students to make sense of graphs.
Physical science activities
Working with several teachers in Pennsylvania, where more than 75,000 students each year take a physical science class in eighth or ninth grade, we developed the first five SmartGraphs activities for a standard curriculum unit on the motion of objects. Graphs are central to the learning goals. Students learn about position-time graphs, slope as a measure of speed or velocity, velocity-time graphs and the acceleration of objects falling under the influence of gravity. Many of these learning goals are similar to those in an algebra class where students often study position-time graphs and learn to interpret the slope of lines as a measure of velocity.

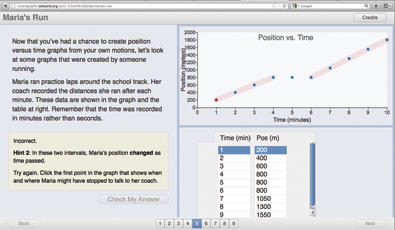
Using SmartGraphs, students draw prediction graphs with a mouse and compare them to data collected by a motion sensor and displayed in the Web browser. They label portions of a graph on the computer screen and calculate the speed of objects based on graphical and tabular representations of data. Students can watch graphs being constructed as the image of a moving car generates position-time and velocity-time graphs. And when students answer embedded questions incorrectly, SmartGraphs provides visual hints, text hints and arithmetic hints to help them understand the graphs and the underlying concepts (like velocity) represented in the graphs (Figure 1).
For each activity, a lesson plan is provided for teachers. In addition, there is a paper-and-pencil student assessment, which can be assigned as homework or used as a quiz after students complete the activity. Three of the five physical science activities use a motion sensor. Each activity takes less than one class period.
Research about SmartGraphs
| Experimental | Control | Significance (p) | |
|---|---|---|---|
| Multiple-Choice | 1.16 | 1.07 | .049 |
| Constructed-Response | 4.19 | 3.64 | .043 |
| Total | 5.07 | 4.30 | .008 |
We designed the five activities for physical science classes with multiple criteria in mind. The activities need to be carefully matched to the learning goals of the motion unit. And they need to help students achieve those goals and be perceived by teachers as useful supplements to the course. In order to discover the extent to which these goals were met, we conducted a large-scale randomized experimental trial of the activities in fall 2011 in 29 Pennsylvania schools.
In 14 schools, 17 experimental teachers used SmartGraphs activities with 49 eighth and ninth grade physical science classes studying the motion of objects. In 15 schools, 18 control teachers taught the same topic using the same textbooks with 42 physical science classes.
This study sought to answer two research questions. First, what do teachers using SmartGraphs physical science activities believe about the software, including how well the software matches important learning goals for the motion unit of study? Based on the 203 sessions when experimental teachers used a SmartGraphs activity with a class, teachers agreed or strongly agreed that the SmartGraphs activities address important learning goals and help students meet those goals. Also, in 99% of the sessions teachers reported they would use the activity again, either exactly as is (63%) or with only minor changes (36%).
The second research question was, Do students who use SmartGraphs activities learn more than comparison students studying the same topic from the same textbooks, but who do not use SmartGraphs activities? To answer this question, nearly 1,700 students completed a pre-test and a post-test that included multiple-choice and constructed-response items assessing students’ understanding of about a dozen learning goals. The experimental students showed greater gains than the control students on three measures: multiple-choice items, constructed-response items and total score (Table 1). In each case, the results were statistically significant.
Answers to both research questions were encouraging. We will continue to conduct research studies in Pennsylvania in the fall.
Creating new activities
Thanks to an easy-to-use and continually improving authoring system, SmartGraphs is now customizable and extensible. Teachers who want to make small changes to an activity can do so before they assign it to their students. Or they can create an entirely new activity.
Six algebra teachers recently became the first group outside our project team to create new activities. These activities are aligned with the Common Core Standards for Mathematics and peer-reviewed. Several are now available on our website.
Next steps
As the physical science and algebra activities demonstrate, learning about graphs in context is critical. Teachers also need to devote time to developing students’ “graph literacy,” namely the ability to identify the important features of a wide variety of graphs and relate those features to the context of the graphs—in other words, to increase students’ understanding of the meaning of graphs. We have begun working with educators in the state of Maine to develop and test free, online graph literacy activities aimed at middle school science classes.
It is easy for teachers to assign Smart- Graphs activities to students or to share them with colleagues. All they need is a URL. Our goal is to have tens of thousands of teachers and students using SmartGraphs activities.
Over the next months and years, we will add new features to SmartGraphs, such as the capability for activity authors to graph any arbitrary function and allow students to interact with it. Another goal is to provide teachers with the option of saving students’ data on a server and to generate reports for teachers about student performance while using the activities. These reports can help teachers understand which graph-related concepts students understand and where they need help. That’s where the smart features of SmartGraphs are especially valuable.
Andy Zucker (azucker@concord.org) is a science curriculum developer.
Rachel Kay (rkay@concord.org) is a research scientist.
This material is based upon work supported by the National Science Foundation under grant DRL-0918522. Any opinions, findings, and conclusions or recommendations expressed in this material are those of the author(s) and do not necessarily reflect the views of the National Science Foundation.

