Visualizing Dissolving with IR Imaging
Did you know that dissolving table salt in water requires energy? Chemists call such a reaction endothermic, but how can you know that’s what really happens? Because seeing is believing!

Infrared (IR) imaging allows you to see the temperature distribution of a system based on detecting the IR radiation it emits. The temperature of a given location reflects the heat absorbed or released there.
IR cameras are easy to use — just point and shoot — and the images are intuitive: color shows temperature distribution. IR cameras are also becoming more affordable (Flir and Fluke sell versions for $1,500-$2,500), making their classroom use more feasible.
An IR camera presents an innovative way to visualize chemical processes that absorb or release heat. This article shows the visualization of dissolving as an example. The heat of solution, which is a measure of the energy absorbed or released when a solvent dissolves in a solute, is 3.9 and 16.7 kJ/mol for table salt (NaCl) and baking soda (NaHCO3), respectively. Both are endothermic, meaning they absorb heat when dissolving in water. IR imaging is sensitive enough to capture the heat of solution of NaCl and show the higher endothermicity of NaHCO3.
This experiment is easy to do and requires only three plastic cups and a few teaspoons of table salt and baking soda? — ?plus an IR camera.
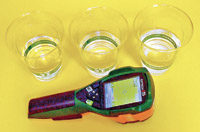
Preparation. Remove everything from a tabletop and place three cups next to each other (Figure 1). Carefully fill the cups with the same amount of water. If you accidentally spill any water outside the cups or on the inside walls, wipe the area with a tissue and wait until it is completely dry. This step is necessary because the highest and lowest temperatures in the IR camera’s viewfinder affect the color of every pixel in an IR image. The evaporative cooling effect from a wet area may create a greater temperature range in which the effect of the heat of solution may become too small to show up in the same IR image. For the same reason, the color of a point may differ from one IR image to another if there is a change of highest or lowest temperature in the viewfinder? — ?even if the temperature at the point itself does not change. It is, therefore, important to have a cup of plain water (no solute) in the viewfinder to provide a reference that will stay at the same temperature throughout the experiment. When analyzing the results, you can only compare colors within the same IR image.
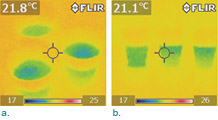
Observation. Before making solutions, take an IR image of the three cups. The image should show no appreciable temperature difference among the three cups (Figure 2a). Note that the cups appear green because water was evaporating, which caused it to be slightly cooler than the environment (you can use an empty cup to confirm this). Now add table salt to one cup and baking soda to another and take an IR image. You should observe a pattern similar to Figure 2b, which shows that both substances sank to the bottom quickly. Most dissolving took place later. The cup in the middle with table salt was slightly cooler, but the cup on the right with baking soda was approximately 3°C cooler at the bottom where dissolving was occurring. You can take an IR image from a different angle that shows the liquid surfaces (Figure 2c). The temperature of the surface of the NaHCO3 solution was the coolest. Quickly remove the cups and immediately take an IR image of the table; you may see some traces of the cooling effect on the tabletop (Figure 2d).

The IR images show that dissolving both substances is endothermic and the heat of solution of baking soda is much greater than that of table salt. (Note: We verified results with a fast-response surface temperature sensor, taking measurements at different locations in the three cups.)
Thanks to IR imaging technology, students can now see the effects of otherwise invisible chemical processes. Because the dissolving process happens slowly, the cooling effect lasts for a while, giving students plenty of time to observe and explore.
A discovery tool
Add more salt and baking soda to the cups to make sure you have saturated solutions. Give the cups a few hours to stabilize and you should see some baffling images (Figure 3). The surfaces of the solutions appeared to be slightly cooler than that of the pure water (Figure 3a). Does this mean that the IR emissivity of a solution is different from that of pure water? If not, why should the surface of a solution be cooler? An IR image from a different angle suggests that the lower parts of the solutions were slightly warmer (about 0.5°C) than the upper parts, whereas the temperature of the pure water was the same throughout (Figure 3b). This is counterintuitive because we would expect that the entire solution should have reached a thermal equilibrium. If not, we would expect the bottom to be cooler since a colder liquid should sink. This puzzling temperature gradient lasts for a long time. You can verify it after three days. What is the thermodynamic driving force for this temperature gradient? If you are curious about figuring this out with us, please visit our blog.

As this experiment shows, IR imaging can be used as a powerful inquiry and discovery tool for exploring chemistry. Capable of detecting a difference of 0.1°C, an IR camera can capture subtle scientific effects quickly and allow students to discover science in a profound way.
Dozens of other experiments? — from phase change to latent heats, heats of reaction, and more — can be investigated. IR imaging opens a new door to chemistry visualization and discovery, making science as colorful and exciting as we know it is.
Charles Xie (qxie@concord.org) is a pioneer of the educational applications of IR imaging who has devised many IR-based experiments for physical science and engineering.
