
Framing Mixed-Reality Labs
Laboratory experiences are indisputably a fundamental part of science education. In order to understand the concepts at work in an experiment, students must place the data they collect into a conceptual framework. However, there is often a wide gap between the raw data and the abstract concepts under investigation. For example, to understand heat transfer measured by a thermometer, students must imagine the invisible flow of thermal energy; to understand the intensities measured by an electromagnetic field sensor, they must visualize an electromagnetic field. In these cases, “heat” and “field” are the conceptual frameworks. A lab would have limited educational value if it could not bridge data and the underlying concepts.


The Mixed-Reality Labs Project funded by the National Science Foundation has set out to develop cyberlearning technologies that promise to narrow the gap for students between data and concepts. Our key strategy is to seamlessly combine the visualization power of simulations and the investigation power of sensors to enhance the learner’s perception of reality. Simultaneously supporting inquiries in both the virtual and physical worlds, this integrated approach transcends the limitations of real labs while retaining their tangibility to make learning physically relevant to students.
Frame Technology
We have recently invented a unique technology to showcase a large class of mixed-reality labs. The Frame technology is based on the fact that the frame of a computer screen is the natural boundary between the virtual world and the physical world and is, therefore, an intuitive user interface for certain human-computer interactions. Compared with other interfaces, the Frame allows users to interact with the computer from the edges of the screen (Figure 1).
In our vision, the Frame is an adjustable structure that can “frame” several kinds of display screens (hence the name). A variety of sensors can be plugged into slots on the Frame. Each sensor slot registers a port number so that the computer knows from which direction the signal comes. If sensors are wirelessly connected to a mobile computer, the entire system becomes portable.
By running a simulation in full screen mode, the data from sensors on the Frame looks as though it’s “transmitted” into the simulated scene in real time. For example, moving a hot object close to the Frame where there are temperature sensors creates an input to an ongoing heat transfer simulation, which then produces a visual effect as if heat could flow into the screen from the hot object. Similarly, directing a light beam onto light sensors on the Frame can create a scenario as if light could shine into a virtual world to warm up a solar house or start photosynthesis in a leaf.
 A tablet thermal imager near a jar of hot water.")
 A tablet thermal imager near ice cubes.")
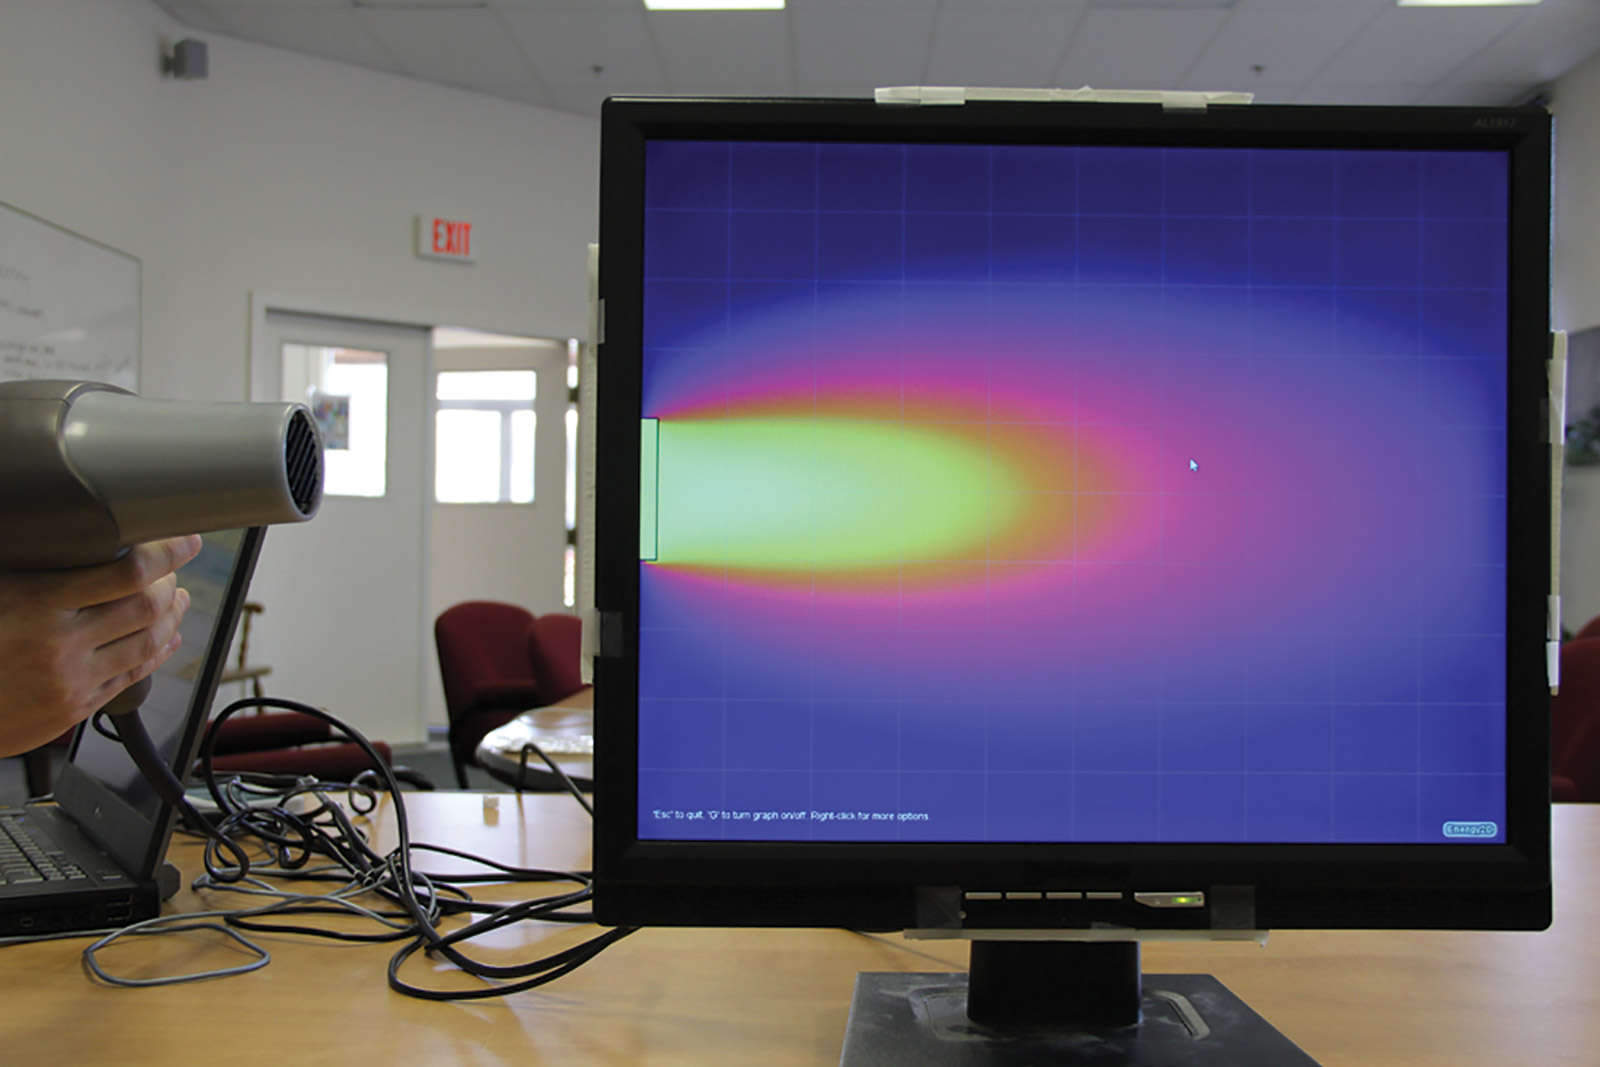
 An LCD display as a thermal imager showing the forced convection by a hairdryer.")
 A projector screen as a thermal imaging wall heated by two jars of hot water at the right edges of two areas representing materials of different thermal conductivities.")
The Frame technology follows the typical way we conduct real experiments, namely, by allowing students to change variables in a system and observe how it responds to those changes. Unlike a real experiment, however, the inputs are applied to change a virtual system. Unlike a virtual experiment, the inputs come from the real world. Bridging the two worlds, the Frame takes advantage of learning opportunities in both worlds.
Three Types of Frames
The Frame is a flexible technology because many different displays can be framed, as the following illustrations demonstrate.
Detector
The Detector Frame converts a tablet computer into a mobile device that can detect changes in the real world and augment the signals with virtual reality. For instance, when a framed tablet approaches a heat source, it will show a flow of thermal energy on the screen as if the screen were thermally sensitive (Figure 2). In this case, the Detector Frame translates obscure raw data into a more understandable and visually appealing picture using computer visualizations. Compared to showing numbers or graphs of data from the sensors, this mixed-reality lab extrapolates the data to the virtual world to provide the contextualization necessary to understand their meaning.
Workbench
The Workbench Frame converts the flat LCD display of a computer into an experiment station. A mixed-reality wind tunnel with one or more anemometers measures the intensity of air streams as the student blows and creates inputs to a running computational fluid dynamics (CFD) simulation visualized on the screen (Figure 3). This lab can teach forced convection, wind turbines, airfoils, and more. Students can explore relationships between real air speed data and virtual flow patterns (e.g., streamlines, vortices, or turbulences).
Projector
The Projector Frame turns a projector screen into a magnified lab on the wall. Sensor bars are mounted on the wall to frame the projection area. Figure 4 shows a mixed-reality atomic microscope projected onto a screen. Temperature and force sensors translate students’ actions on the sensor bars into signals that are then used to adjust variables such as temperature and pressure.

In the gas simulation shown in Figure 4, a student can push the piston to compress the gas by exerting a force on the sensor bar. Another student can heat up or cool down the gas by moving a hot or cold source to where the temperature sensor is located.
The actions of these two students can be performed at the same time, creating an interaction between them mediated by the simulation. For example, while one student is compressing the gas, another student can simultaneously explore how much she should heat up the gas in order to push the piston back, which leads to understanding the Ideal Gas Law in a collaborative setting.
Looking Ahead
In purely virtual experiments, students interact with simulations through clicking or touching widgets on the screen that represent physical variables. Mixed-reality experiments replace these graphical widgets with multisensory inputs (such as light, heat, or pressure) that are semantically integrated with virtual and physical elements. This technology could help students build stronger mental associations of perceived facts and visualized concepts.
Mixed-reality applications depend on sensors to detect the changes caused by users or the environment. Although sensors are now an important and ubiquitous part of smartphones and tablets, the number and types of sensors supported by those devices are — and will continue to be — limited.
Manufacturers are unlikely to include all the sensors on the wish list of science education. But imagine a future when you can buy “frames” or cases for your computers that will have customized sensors. Our Mixed-Reality Labs project is paving the road for that future.
Charles Xie (qxie@concord.org) directs the Mixed-Reality Labs Project and has invented the Frame technology.
This material is based upon work supported by the National Science Foundation under grant IIS-1124281. Any opinions, findings, and conclusions or recommendations expressed in this material are those of the author(s) and do not necessarily reflect the views of the National Science Foundation.