Under the Hood: Streaming Arduino Data to a Browser
What if you were reading a blog or working through an online lesson and you could just plug in your sensor and start taking data or interacting with models right in your own browser?

Here at the Concord Consortium, our interest in sensors goes back (way back!) to the early 1980s when Bob Tinker and Stephen Bannasch developed the earliest sensor prototypes and ignited an industry. Since then, we’ve been obsessed with making sensors that are easy to use in the classroom. Our newest interest is embedding them directly into rich online curricula. We’ve already done this using applets as an intermediary to read data from commercial USB sensors and display them in graphs in the browser. When we think of hackable, fun, multi-probe sensors, though, we naturally think of Arduinos — we are open-source geeks after all.
// connecting Arduino to a molecular model window.onload = function() { var arduino = new ArduinoEthernetCom( {frequency: 2} ); var atomicModel = $(‘iframe’)[0].contentWindow.model; arduino.addObserver(function(pinValues) { var pin0 = pinValues.A0, temp = (((pin0 * 5) / 1024) - 0.5) * 100; // TMP36 sensor calibration atomicModel.temperature(temp); }); document.getElementById(‘runButton’).onclick = function() { arduino.start(); } }
In thinking of ways to display Arduino data in a browser with the minimum amount of fuss, we considered our existing applet technique, but applets don’t work in all schools or on mobile devices. Instead we could simply use the common Ethernet Shields (or the new Arduino Ethernets) to send data directly to the browser.
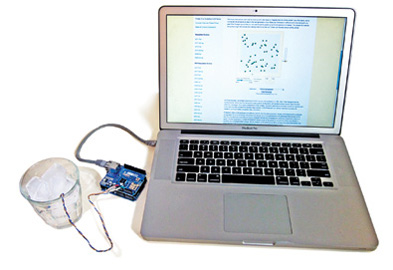
With this idea in hand, it was quick work to hack a generic Arduino Server example to send back values of the analog pins and create a Web page that would rapidly poll the Arduino for data. A few lines of code later, we had a working example, usable with any Ethernet-capable Arduino on any browser (Figure 1).
With the Web version of this article, you can try it yourself! You’ll just need to upload a tiny sketch to your Arduino, plug it in via an Ethernet cable, and you’ll be able to start plotting sensor data in the graph right here in the online article. Voila.
- Upload the tiny server sketch to your Arduino
- Plug in your ethernet shield, connect the Arduino to your computer with an ethernet cable and wait about 30 seconds for the Arduino server to boot up
- Optionally connect a sensor to pin A0. (The demo below is scaled for a L35 temperature sensor, but you don’t need it — you might need to rescale the graph by dragging on the axis to see the plot, though)
- Click the “Start Reading” button below
You should see your Arduino data filling up the graph. If not, wait another 20 seconds to ensure the server is fully booted and click the “play” button at the top right to start it again.
Since all the interesting code for dealing with data is in JavaScript (click the “JavaScript” tab above!), it’s easy to modify and play with right in the browser.
We can’t wait to come up with new ways to integrate this into online content. As a first demo of this, we connected the temperature data to the next generation of our Molecular Workbench software, so that you can see the atoms speed up as the temperature increases. Try it out yourself.
Sam Fentress (sfentress@concord.org) is a Software Engineer.
Scott Cytacki (scytacki@concord.org) is a Senior Software Engineer.
