
SmartGraphs Software Helps Students Learn Using Graphs
Graph interpretation is a central skill in all fields of science, mathematics, and technology. For members of the public, understanding significant scientific and societal concepts — such as global warming, the stock market, their BTC profit, or housing price fluctuations — often depends on making sense of graphs. Nonetheless, students of all ages demonstrate difficulties interpreting graphs. Students need to repeatedly explore, create, manipulate, and explain graphs in order to learn how to use them well. It’s the same process as learning the three R’s, and equally fundamental.
The SmartGraphs project is designed to help. It was funded by the National Science Foundation to follow up on seminal work in making science activities accessible to all learners through our Universal Design for Learning (UDL) Science project. We are developing free, open source software designed to help secondary math and science students become comfortable with graph interpretation.
SmartGraphs help students to learn about graphs and the concepts represented in graphs by interacting with them. Hints and scaffolds — such as visually highlighting portions of graphs, stepping students through calculations of slope, reminding students about units of measurement, helping them understand and use scales, and pointing out links between representations (such as a table and a graph) — are used only when needed. Pilot teachers tell us that this individualized assistance to students is invaluable, saving the teacher time while offering practice to students who can benefit from it.
The Boiling Water activity
To experiment with some of these features, try our demonstration activity on the Curriculum tab at the SmartGraphs website. The “Boiling Water” activity starts by describing water being heated on a stovetop. A thermometer immersed in the water reads 90 degrees Celsius. Five minutes later, when the water begins to boil, the thermometer reads 100 degrees. After reading this scenario, students are asked to sketch a graph showing the temperature over a ten-minute period, starting when the thermometer reads 90 degrees.
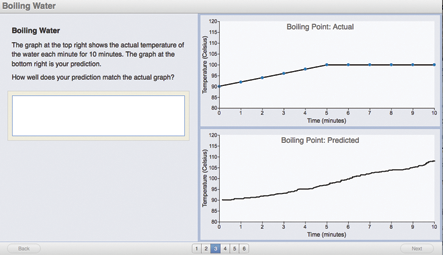
Page 3 of the multi-page activity shows three panes: text and student responses on the left, the student’s prediction on the bottom right, and the actual temperature graph, created by the activity’s author, on the top right (Figure 1). The student is asked to compare his or her prediction to what was recorded. In this example, the student incorrectly predicted that the temperature would continue rising after the water boiled — a common misconception.
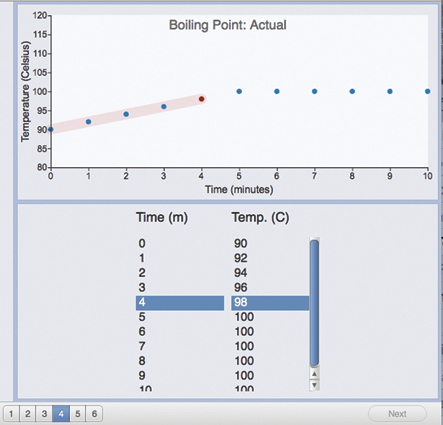
Students must then click on a point depicting the temperature one minute or more after the water has started to boil (Figure 2). Since the student’s selection (a red point) is incorrect, SmartGraphs highlights a section of the graph corresponding to the student’s choice, and the text reads, “Incorrect. In the highlighted section of the graph the water was not yet boiling. Try again.” Students must respond with a correct answer before they can move on to the next page of the activity.
At each stage, students get feedback about their graph interpretation skills — in other words, they learn to understand the “story” of the graph. The goal is that with repeated exposure to key features and processes — and the ability to interact with a graph and get individualized feedback — students will become more adept at graph interpretation and rely on scaffolding less over time.
In the Boiling Water example, students are learning both about graph interpretation skills and about an important physical science concept, the boiling point of a liquid. Other SmartGraphs activities will focus on graphs and concepts applied to algebra, forces and motion, and eventually other topics. The activities can make use of sensors attached to a computer, so that, for example, as part of the lesson students can use a motion sensor to learn about position-time graphs, velocity, or acceleration.
The Future of SmartGraphs
Prior work in schools using software that requires large downloads has shown that the existence of firewalls, proxies, or limited bandwidth can bring a class lesson using computers to a standstill. To mitigate these technology problems, SmartGraphs activities run directly in any modern Web browser without the use of Java, plug-ins, or software installation (with one exception: the use of sensors in SmartGraphs calls up an invisible Java applet). Our goal is to make SmartGraphs activities easy to use, so teachers will not need technical support staff to make the software run. SmartGraphs activities will soon save data during a session so that students’ predictions, graphs, open-ended answers, screenshots, and multiple-choice responses can be reported at the end of a lesson. These reports of student work could be emailed to the teacher or printed for teachers to use when assessing student performance.
One Concord Consortium project, the Innovative Technology in Science Inquiry Scale Up project (see pages 8-9), already allows teachers to customize existing exemplary activities directly within a Web browser using a template. The Smart- Graphs project is expanding this type of Web browser authoring environment for teachers to permit not only textual or graphical changes, but also the capability of teachers to scaffold questions and add hints to their lessons, as illustrated in the Boiling Water activity. Eventually teachers will be able to create new SmartGraphs lessons from scratch. As authors outside the Concord Consortium create lessons, more and more free activities will be available, which will be distributed through a project portal where teachers can select and assign specific activities to their classes.
Research in Classrooms for the Future
During the 2011-2012 school year, six to eight physical science lessons will be tested in Pennsylvania as part of a randomized experimental trial with several dozen teachers who are part of the state’s Classrooms for the Future (CFF) initiative. (CFF has provided more than 140,000 laptop computers to high schools across Pennsylvania.) The hypothesis of the research study is that students who use SmartGraphs will achieve more of the key learning goals in the physical science unit than students in comparison classes where SmartGraphs activities are not used. Will SmartGraphs make students smarter about graphs? We think so.
Learn more
Visit our website in the coming months to find free activities using innovative software to help students learn graphs and the concepts represented in graphs. Please contact us at smartgraphs@concord.org if you would like to be on our email list.
Andy Zucker (azucker@concord.org) is a senior research scientist and co-directs the SmartGraphs project.
Carolyn Staudt (cstaudt@concord.org) directs the SmartGraphs project.
This material is based upon work supported by the National Science Foundation under grant DRL-0918522. Any opinions, findings, and conclusions or recommendations expressed in this material are those of the author(s) and do not necessarily reflect the views of the National Science Foundation.