Natural Selection
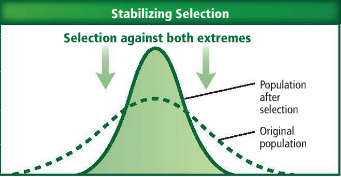
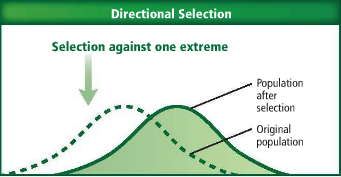
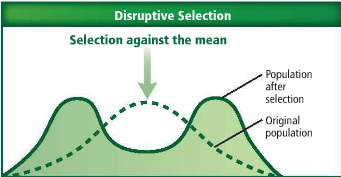
Natural selection can alter allele frequencies of a population in three ways. The bell-shaped curve shown as a dotted line in each graph indicates the trait's original variation in a population. The solid line indicates the outcome of each type of selection pressure.
To get a better feel for how this works, consider the graph below. Each dot represents a particular plant placed along the horizontal axis which indicates the amount of some trait the plant has. Each slider controls something about the distribution of traits. Experiment with the sliders to determine how to produce each of the three ways of altering allele frequencies.
Which slider produces each kind of alteration?
Stabilizing:
Directional:
Disruptive:
Questions
- Describe the effect of increasing std_dev. What would this correspond to in terms of selection pressure?
- Use the sliders to produce selection that is against the upper extreme and against the mean. Describe the result.
- Suppose that the trait is the length of leaves measured in centimeters. Use the sliders to simulate an environment in which leaves less than 4 cm long don't gather sufficient sunlight for the plant to survive. Describe how you accomplished it. Is there more than one way?