Heating and Cooling
We put 500 mL of water in a saucepan and put that on our stove. At time zero, we turned the stove on high. Then, from time to time, we recorded the time and the temperature of the water. When the water boiled, we turned the stove off.
The table and graph show the data we gathered.
Questions
- Describe what the graph tells you about the heating and cooling qualitatively.
- Describe what the graph tells you about the heating and cooling quantitatively.
Put a movable line in the plot to help you answer the next question.
Try this
 Notice that the column for time_sec isn't being used in the graph. That explains why the increasing temperature part of the plot is jaggy instead of smooth. Let's change that.
- From the table's Gear menu, choose New Attribute in Temperatures.
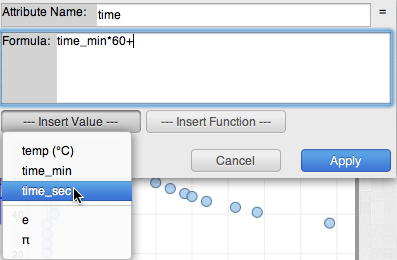
- Give the new attribute the name 'time' and give it a formula that will make use of both time_min and time_sec.
- Drag the new attribute by its column title to the horizontal axis of the graph.