The Challenge of an Open-Ended Design Challenge
During China’s notorious three-day national college entrance exam you hear prayers everywhere. My life—indeed, every high school student’s life in China—would be different following the exam, or so we were told. The physics test was on the hottest day. A couple of useless fans sputtered above, pitying us. I swept through the test and felt good—until the last question. After reading it three times, my heart was pounding and my brain was numb. The question included a complex machine I had never seen. Decompose and find the equations, I told myself. Divide and conquer. I scribbled all over the margins, yet the solution kept falling apart. The clock was ticking.
The answer eventually arrived—in time. I suspect it was a matter of luck or, perhaps, my hobby of doodling helped to model the bizarre machine. The door to my dream college was opened, but life afterwards was far from a smooth sail. At every step, I stumbled. That last physics question always came up. I wish I had learned to be comfortable with novelty, complexity, and uncertainty.
Energy3D
In the spring of 2015, the Big Data project, funded by the National Science Foundation, brought our Energy3D software, a simulated engineering design environment (SEDE), to freshmen physics classrooms. Students designed energy-efficient homes and city blocks, and the challenge was nontrivial. Students had to understand the science of thermodynamics, the impact of the sun’s path, and functions of various building materials. They had to assess the pros and cons and complete the design project under budget. There were hundreds of decisions to make.
(Your students can try this design challenge, too! See “Monday’s Lesson: Designing an Energy-Plus Home” in the fall 2015 @Concord and Energy3D-Based Engineering Design Projects for Students.)
The project is multidisciplinary and invites design thinking and spatial skills. There is no direct instruction, no correct answer, and no explicit guidance. Adults deal with things like this all the time. But high school students?
On the first day, one student noted, “They [the solar panels] are on the level of 10% [solar panel efficiency], because I do not totally understand what the solar panel scale means. I put the Solar Heat Gain Coefficient to 80%. Once again, I don’t understand what the numbers mean.”
Later in the design process, she complained several times, “I’m stuck. I’m seemingly so close to the efficiency level I need to achieve, but the changes I make don’t seem to make much of a difference at all.” Near the end, she still struggled: “I put in solar panels and made sure that the windows were covered by trees. The problem with making a colonial house is that the walls and roof were extremely expensive. My area was towards the smaller side, but balancing the amount of windows against the energy efficiency was extremely difficult. I never got below a 5000 net energy.” She reminded me of exam day: the searching, failing, and rising to try again.
What was so challenging about this design challenge?

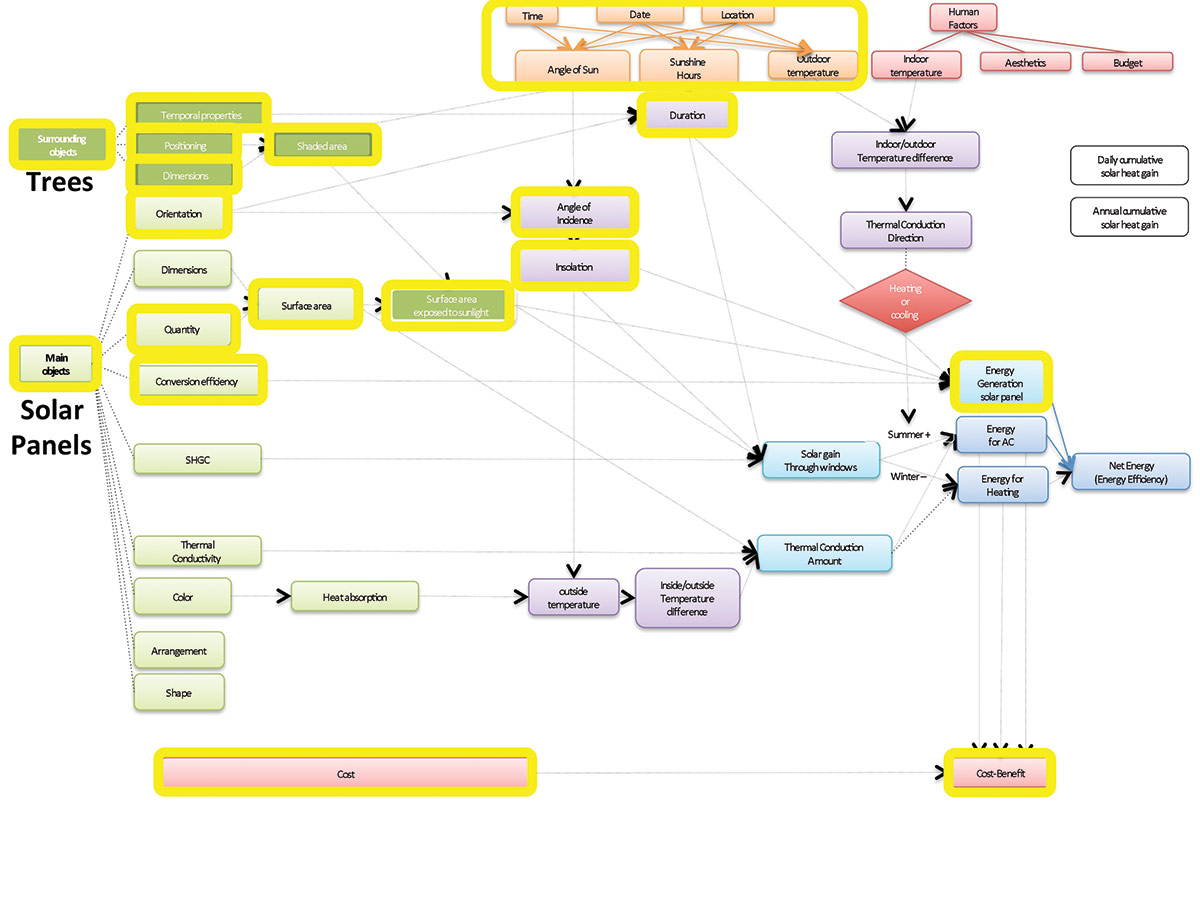
A concept map of green building science
The concept map of design elements and science concepts (Figure 1) provides an overview of the energy-efficient home design challenge. As illustrated with arrows between nodes, a building’s energy performance is determined by numerous factors embedded in a complicated interdependent web. For instance, the highlighted nodes represent the subsystem of solar panels. To optimize the performance of solar panels, students need to consider multiple factors including orientation, surface area, solar conversion rate, shade by surrounding objects, etc. Changing one factor may cause a chain of effects and create unforeseen repercussions on the final outcome.
With no trail to follow, how do students move through this complex web of design elements and science concepts? Thanks to Energy3D’s powerful logging engine, we are able to capture students’ moment-by-moment design actions as well as the intermediate states and energy performance of their designs. Combining these data streams and plotting them over time provides a window into their mental processes throughout the design project.
Another student, a quiet and conscientious girl who started with little knowledge in this subject, attained the largest learning gain. How did she do it? Figure 2 [s1-s8] shows her solar panels’ performance (kWh/ panel) over time during the first design. Although the overall trend was positive, there were many fluctuations and some performance drops that canceled out previous improvements. Why did she keep regressing? If she found a way to improve the average energy generation, why didn’t she stick with the solution? The design snapshots below the time graph shed some light on her seemingly erratic design behavior.

Initially, she put 32 panels of 10% solar conversion rate all over the oddly shaped roof [s1]. She was rather unconcerned with them until their performance declined significantly due to the tall trees she planted around the house [s2]. However, instead of moving the trees, she opted to reshape her roof so the panels could face south [s3]. This move boosted the panels’ performance, but she still missed the critical factor— the tall trees. She may have used the trees to provide shade in the summer to save on air conditioning costs. Later, she moved the trees even closer to the house, further compromising the solar panels’ performance. Rather than addressing the problematic shade from the trees, however, she made a pyramid roof and added up to 59 panels to increase energy generation. She then realized that only 40 panels were allowed in the design specifications [s4].
After 20 minutes, her design changed completely. We cannot be sure what she was thinking, but the trees were gone, and 40 panels were neatly lined up on the south, east, and west sides of the house [s5]. The panels’ performance peaked. Just a few minutes later, she planted eight tall trees on the westside, possibly compelled by the desire to include some landscape features in her design [s6]. Soon she realized this was not a good move and removed the trees and replaced 12 panels with higher conversion rate [s7]; she also moved some panels to the south-facing roof [s8]. In the end, she found a solution for the first design, and she continued to improve her solar panels’ performance in two additional designs with ease. There was a lot of back and forth, but her discoveries served her well.
Watching her design path was painstaking. I could hardly refrain from helping. But years from now, even if she’s forgotten how to design an energy-efficient house, she may remember the perplexing situation she was in, the discomfort she felt, and the perseverance that ultimately paid off.
Jie Chao (jchao@concord.org) is a learning scientist.
This material is based upon work supported by the National Science Foundation under grant DRL-1348547. Any opinions, findings, and conclusions or recommendations expressed in this material are those of the author(s) and do not necessarily reflect the views of the National Science Foundation.