Visualizing Student Learning
More than fifteen years ago, I worked as a postdoc in computational biophysics. Our dream was to uncover the secrets of life through numerical simulations based on solving foundational equations in physics. We believed that, if we could simulate the motion of every atom and every wave function of a protein or DNA molecule, we could eventually figure out the tricks of biology.

Computation is not the only bottleneck in attaining this goal. In fact, through over more than half a century of research on molecular modeling consecrated by three Nobel Prizes (the latest in 2013), a wealth of computer code has been developed. Meanwhile, many state-of-the-art supercomputers have been available for life scientists.
The end of a computer run is just the beginning of a daunting task: post-processing vast quantities of calculated data. Although scientists can build more powerful computers and write more efficient code, nothing can replace human intelligence for searching spatial, temporal and energetic patterns buried in data. Ultimately, it is through analyzing these patterns that we come to an understanding of the science they represent.
Human analysts rely on visualizations to find patterns and trends in an ocean of data. For example, the atomic coordinate data of a biomolecular system appear to be random dots when plotted (Figure 1a). But when they are connected using a code known to scientists, some structures emerge (Figure 1b). Many readers can recognize that this is a compound of a DNA and a protein molecule. Observing how this system evolves over time under different conditions, we can hope to identify the intermolecular forces between the protein and the DNA that are responsible for phenomena such as DNA translation and replication.
Fifteen years later, I am facing another challenge of a similar magnitude. Only this time, the data are generated not by thousands of atoms in simulations but by thousands of students in classrooms. This article explains why data visualization has, once again, become an indispensable part of my research.
Mind recorders
One of the most important goals in the learning sciences is to understand how students learn. Traditionally, learning is assessed through tests. But tests may not be the best way to measure and monitor the development of sophisticated skills such as scientific inquiry and engineering design.
Just as atoms cannot be seen by the naked eye, the workings of the human mind are also invisible. Researchers may carefully observe students, ask them questions and assess their learning from their actions and responses, but that approach is too laborious to be scalable. To cover all students, a fundamentally different method is needed.
To “see” atoms, scientists invented techniques such as X-ray crystallography, which produces informative diffraction waves. What, then, is the equivalent of X-ray diffraction for reading students’ minds while they are learning?
The answer lies in digital inquiry and design tools that are by now ubiquitous. These interactive tools are commonly viewed as “technology interventions” introduced to enhance learning. But with some additional work, they can also be turned into “mind recorders” (see Figure 2 for an example) because students’ interactions with them invariably leave digital traces that reflect how a student reacts to problems, instruction or other stimuli with actions. Such a mind recorder can work at a high frequency that enables every mouse, key, touch or other sensor signal and every change of an artifact property to be logged. Recording these data points is thus analogous to recording the motion of every atom in a biophysics simulation. Because these data points also represent units of interaction or events that cannot be divided further, we often refer to them as “atoms.” From the data streams of these atoms, a high-resolution picture of learning can be reconstructed for in-depth analysis. In analogy to the post-processing step in computer simulation, we have a data analysis job to do.

Data clouds
At first glance, the raw data may appear to be simply points scattered in the learning space, resembling the atomic coordinate data of macromolecules. Figure 3 shows such “data clouds” of two students’ actions with our Energy3D software as they were solving a solar urban design challenge. They chose the shapes, orientations and layouts of a cluster of buildings in a metropolitan area with the goal of achieving optimal solar performance in different seasons for the whole community. How can we extract any clue of learning from these seemingly random data?
Compared to answering multiple-choice questions, creative inquiry and design processes are often highly open-ended, especially when the problem space consists of many degrees of freedom. Thus, it may not be feasible to enumerate, a priori, all possible pathways for solving a specific problem. Given a tremendous number of possibilities, researchers can hardly find two identical instances in student data, posing a great difficulty to developing statistical modeling techniques for reliably predicting students’ learning trajectories. Without such a “compass,” it is all too easy to get lost in a cloud of data. This difficulty is similar to hard problems in natural science. For instance, the research on protein folding is also confronted by an astronomical number of evolutionary pathways in a gigantic phase space. As such, insights garnered from those fields may guide educational research as well.
Not long ago, educational researchers began to seek help from machine learning. Educational data mining and learning analytics are the two closely related research branches that have recently emerged as a result. However, few researchers in those fields face the challenge of analyzing the complex learning dynamics in inquiry and design activities that is ruled by the tyranny of high dimensionality described above. This puts our research in a frontier of process analytics that has rarely been explored. It was through working in this vastly unknown area that we realized the pivotal importance of computational thinking in educational research. This change of mindset has enabled us to frame problems in learning sciences with concepts in computational science, especially with those in signal processing, time series analysis, graph theory and pattern recognition. Across the board, visualizations are playing a central role in our research and are giving rise to new developments in learning infographics.

Holographic visualizations
As in any other scientific discipline, visualizations are invaluable tools in educational research. To see structures in data, researchers must first define the indicators for measuring student performance, proving a hypothesis or capturing a cognitive response. Using the molecular structure metaphor, these indicators constitute the “chemical bonds” that connect the dots or “secondary structures” that track learning progresses. Figure 3 illustrates how such an indicator can be used to visualize iterative patterns in data clouds. Infographics like this allow evidence of iteration, a cognitive process key to engineering design, to be visualized and evaluated.
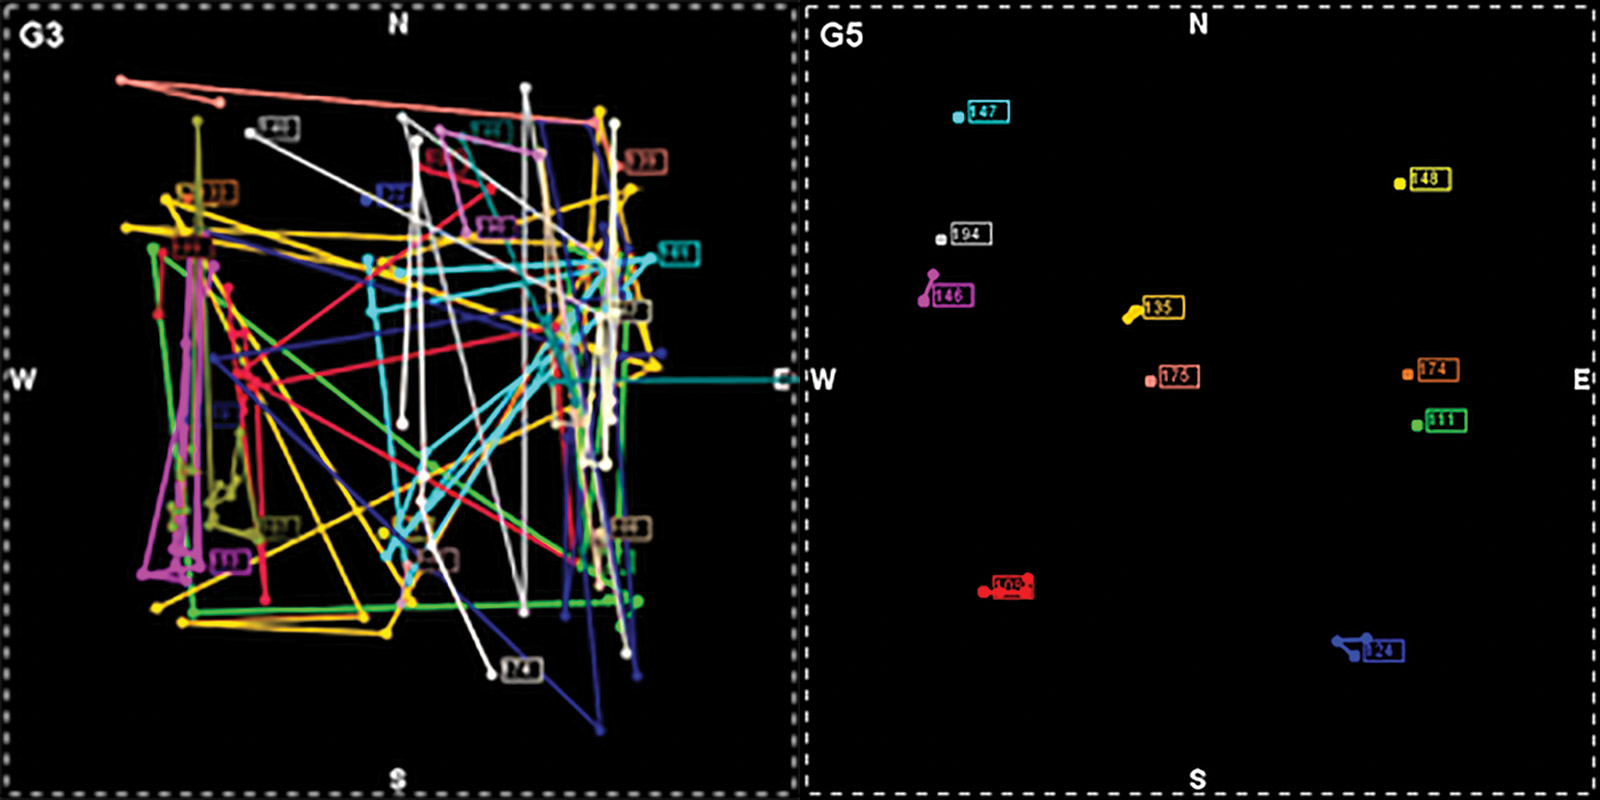
In addition to the projection onto the axis of time for showing temporal patterns, high-dimensional data clouds can also be projected onto a Cartesian coordinate system to reveal spatial patterns or a digraph model of a concept map to reveal learning paths. Figure 4 provides an example of visualizing design optimization using a 2D plot of artifact movement. This capacity of viewing a single data cloud from different perspectives to sift different information is the result of the “holographic” nature of the data, a profound feature that allows researchers to simplify problems through dimensionality reduction and create reliable assessments through triangulation.
Learning sciences as data science

The Common Guidelines for Education Research and Development, published in 2013 by the Institute of Education Sciences and the National Science Foundation, begins, “At its core, scientific inquiry is the same in all fields. Scientific research, whether in education, physics, anthropology, molecular biology, or economics, is a continual process of rigorous reasoning supported by a dynamic interplay among methods, theories, and findings. It builds understanding in the form of models or theories that can be tested.”
Indeed, there has never been a better time to highlight the scientific nature of educational research. Today, the digital footprints left behind by millions of students who use interactive tools such as sensors, simulations or mixed-reality apps are being aggregated into a gold mine of research data. Similar to what happened in molecular biology decades ago, this flux of data is driving learning sciences into the domain of data science; one may hope that this will eventually allow useful learning informatics to be engineered.
But this vision will not be realized without extensive interdisciplinary research. The discovery of knowledge from large sets of learner data is a computational problem that can only be solved by uniting educational research and computational science.
Charles Xie (qxie@concord.org) is a senior scientist who works at the intersection between computational science and learning sciences.
This material is based upon work supported by the National Science Foundation under grants DRL-1348547 and IIS-1124821. Any opinions, findings, and conclusions or recommendations expressed in this material are those of the author(s) and do not necessarily reflect the views of the National Science Foundation.